Create a Pareto chart (without using any Excel template) based on the information in the following table. First, create a spreadsheet in Excel using the data in the table. List the most frequent customer problems first and then make the Pareto chart. Interpret the data represented by your Pareto chart
Create a Pareto chart (without using any Excel template) based on the information in the following table. First, create a spreadsheet in Excel using the data in the table. List the most frequent customer problems first and then make the Pareto chart. Interpret the data represented by your Pareto chart

College Algebra
7th Edition
ISBN:9781305115545
Author:James Stewart, Lothar Redlin, Saleem Watson
Publisher:James Stewart, Lothar Redlin, Saleem Watson
Chapter9: Counting And Probability
Section: Chapter Questions
Problem 3T: An Internet service provider requires its customers lo select a password consisting of four letter...

Related questions
Question
3. Create a Pareto chart (without using any Excel template) based on the information in the
following table. First, create a spreadsheet in Excel using the data in the table. List the most
frequent customer problems first and then make the Pareto chart. Interpret the data represented
by your Pareto chart. Make sure that given the data your resulting chart looks similar to the
one in Figure 8-7.
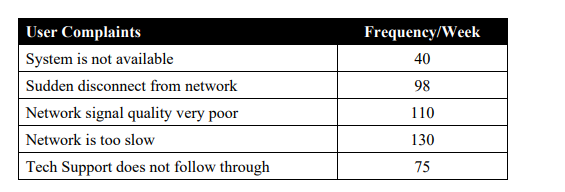
Transcribed Image Text:User Complaints
Frequency/Week
System is not available
40
Sudden disconnect from network
98
Network signal quality very poor
110
Network is too slow
130
Tech Support does not follow through
75
Expert Solution
This question has been solved!
Explore an expertly crafted, step-by-step solution for a thorough understanding of key concepts.

This is a popular solution!

Trending now
This is a popular solution!

Step by step
Solved in 2 steps with 1 images

Recommended textbooks for you
College Algebra
Algebra
ISBN:
9781305115545
Author:
James Stewart, Lothar Redlin, Saleem Watson
Publisher:
Cengage Learning

Algebra and Trigonometry (MindTap Course List)
Algebra
ISBN:
9781305071742
Author:
James Stewart, Lothar Redlin, Saleem Watson
Publisher:
Cengage Learning
College Algebra
Algebra
ISBN:
9781305115545
Author:
James Stewart, Lothar Redlin, Saleem Watson
Publisher:
Cengage Learning
Algebra and Trigonometry (MindTap Course List)
Algebra
ISBN:
9781305071742
Author:
James Stewart, Lothar Redlin, Saleem Watson
Publisher:
Cengage Learning