Create a Scatterplot of y against estimated median SAT among college freshmen.

Glencoe Algebra 1, Student Edition, 9780079039897, 0079039898, 2018
18th Edition
ISBN:9780079039897
Author:Carter
Publisher:Carter
Chapter10: Statistics
Section: Chapter Questions
Problem 11MCQ

Related questions
Question
Create a Scatterplot of y against estimated median SAT among college freshmen.
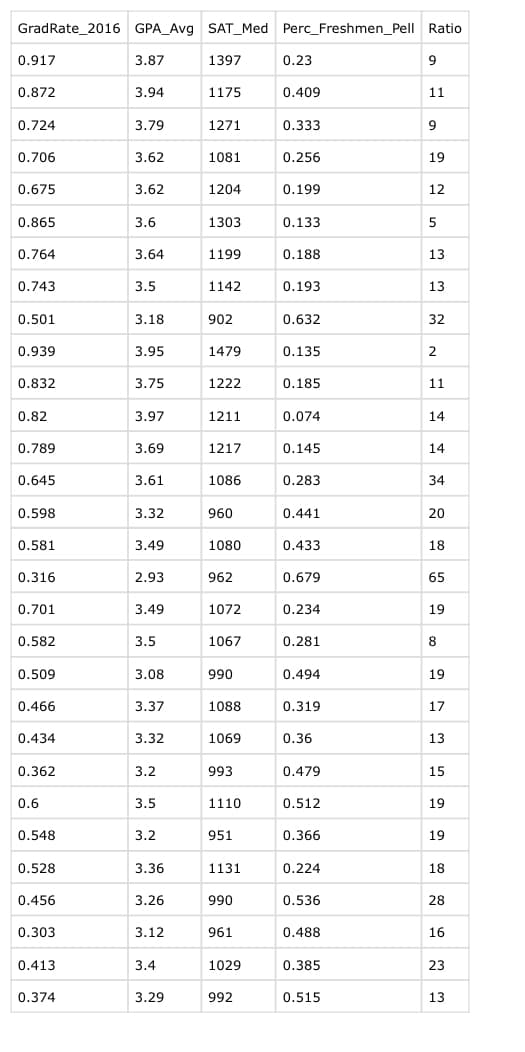
Transcribed Image Text:GradRate 2016 GPA_Avg SAT_Med Perc_Freshmen_Pell Ratio
0.917
0.872
0.724
0.706
0.675
0.865
0.764
0.743
0.501
0.939
0.832
0.82
0.789
0.645
0.598
0.581
0.316
0.701
0.582
0.509
0.466
0.434
0.362
0.6
0.548
0.528
0.456
0.303
0.413
0.374
3.87
3.94
3.79
3.62
3.62
3.6
3.64
3.5
3.18
3.95
3.75
3.97
3.69
3.61
3.32
3.49
2.93
3.49
3.5
3.08
3.37
3.32
3.2
3.5
3.2
3.36
3.26
3.12
3.4
3.29
1397
1175
1271
1081
1204
1303
1199
1142
902
1479
1222
1211
1217
1086
960
1080
962
1072
1067
990
1088
1069
993
1110
951
1131
990
961
1029
992
0.23
0.409
0.333
0.256
0.199
0.133
0.188
0.193
0.632
0.135
0.185
0.074
0.145
0.283
0.441
0.433
0.679
0.234
0.281
0.494
0.319
0.36
0.479
0.512
0.366
0.224
0.536
0.488
0.385
0.515
9
11
9
19
12
5
13
13
32
2
11
14
14
34
20
18
65
19
8
19
17
13
15
19
19
18
28
16
23
13
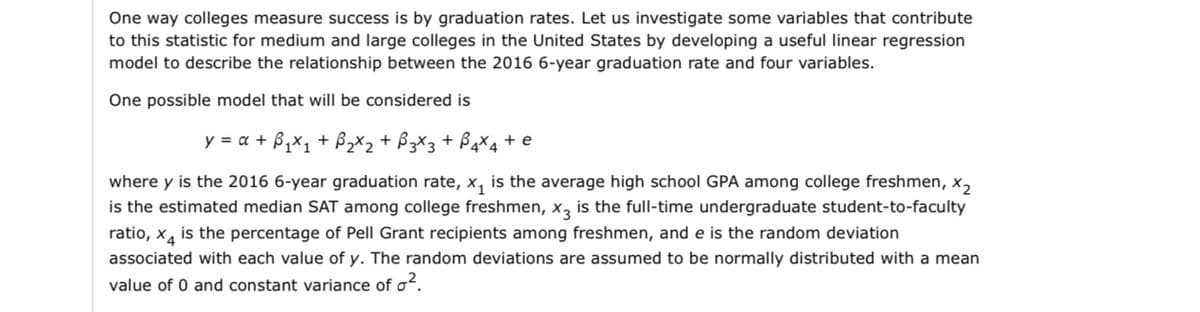
Transcribed Image Text:One way colleges measure success is by graduation rates. Let us investigate some variables that contribute
to this statistic for medium and large colleges in the United States by developing a useful linear regression
model to describe the relationship between the 2016 6-year graduation rate and four variables.
One possible model that will be considered is
y = x + ₁x₁ + ₂x₂ + B3x3 + 4x4 + e
where y is the 2016 6-year graduation rate, x₁ is the average high school GPA among college freshmen, X2
is the estimated median SAT among college freshmen, x3 is the full-time undergraduate student-to-faculty
ratio, x is the percentage of Pell Grant recipients among freshmen, and e is the random deviation
associated with each value of y. The random deviations are assumed to be normally distributed with a mean
value of 0 and constant variance of o².
Expert Solution
This question has been solved!
Explore an expertly crafted, step-by-step solution for a thorough understanding of key concepts.

This is a popular solution!

Trending now
This is a popular solution!

Step by step
Solved in 3 steps with 1 images

Recommended textbooks for you
Glencoe Algebra 1, Student Edition, 9780079039897…
Algebra
ISBN:
9780079039897
Author:
Carter
Publisher:
McGraw Hill
Glencoe Algebra 1, Student Edition, 9780079039897…
Algebra
ISBN:
9780079039897
Author:
Carter
Publisher:
McGraw Hill