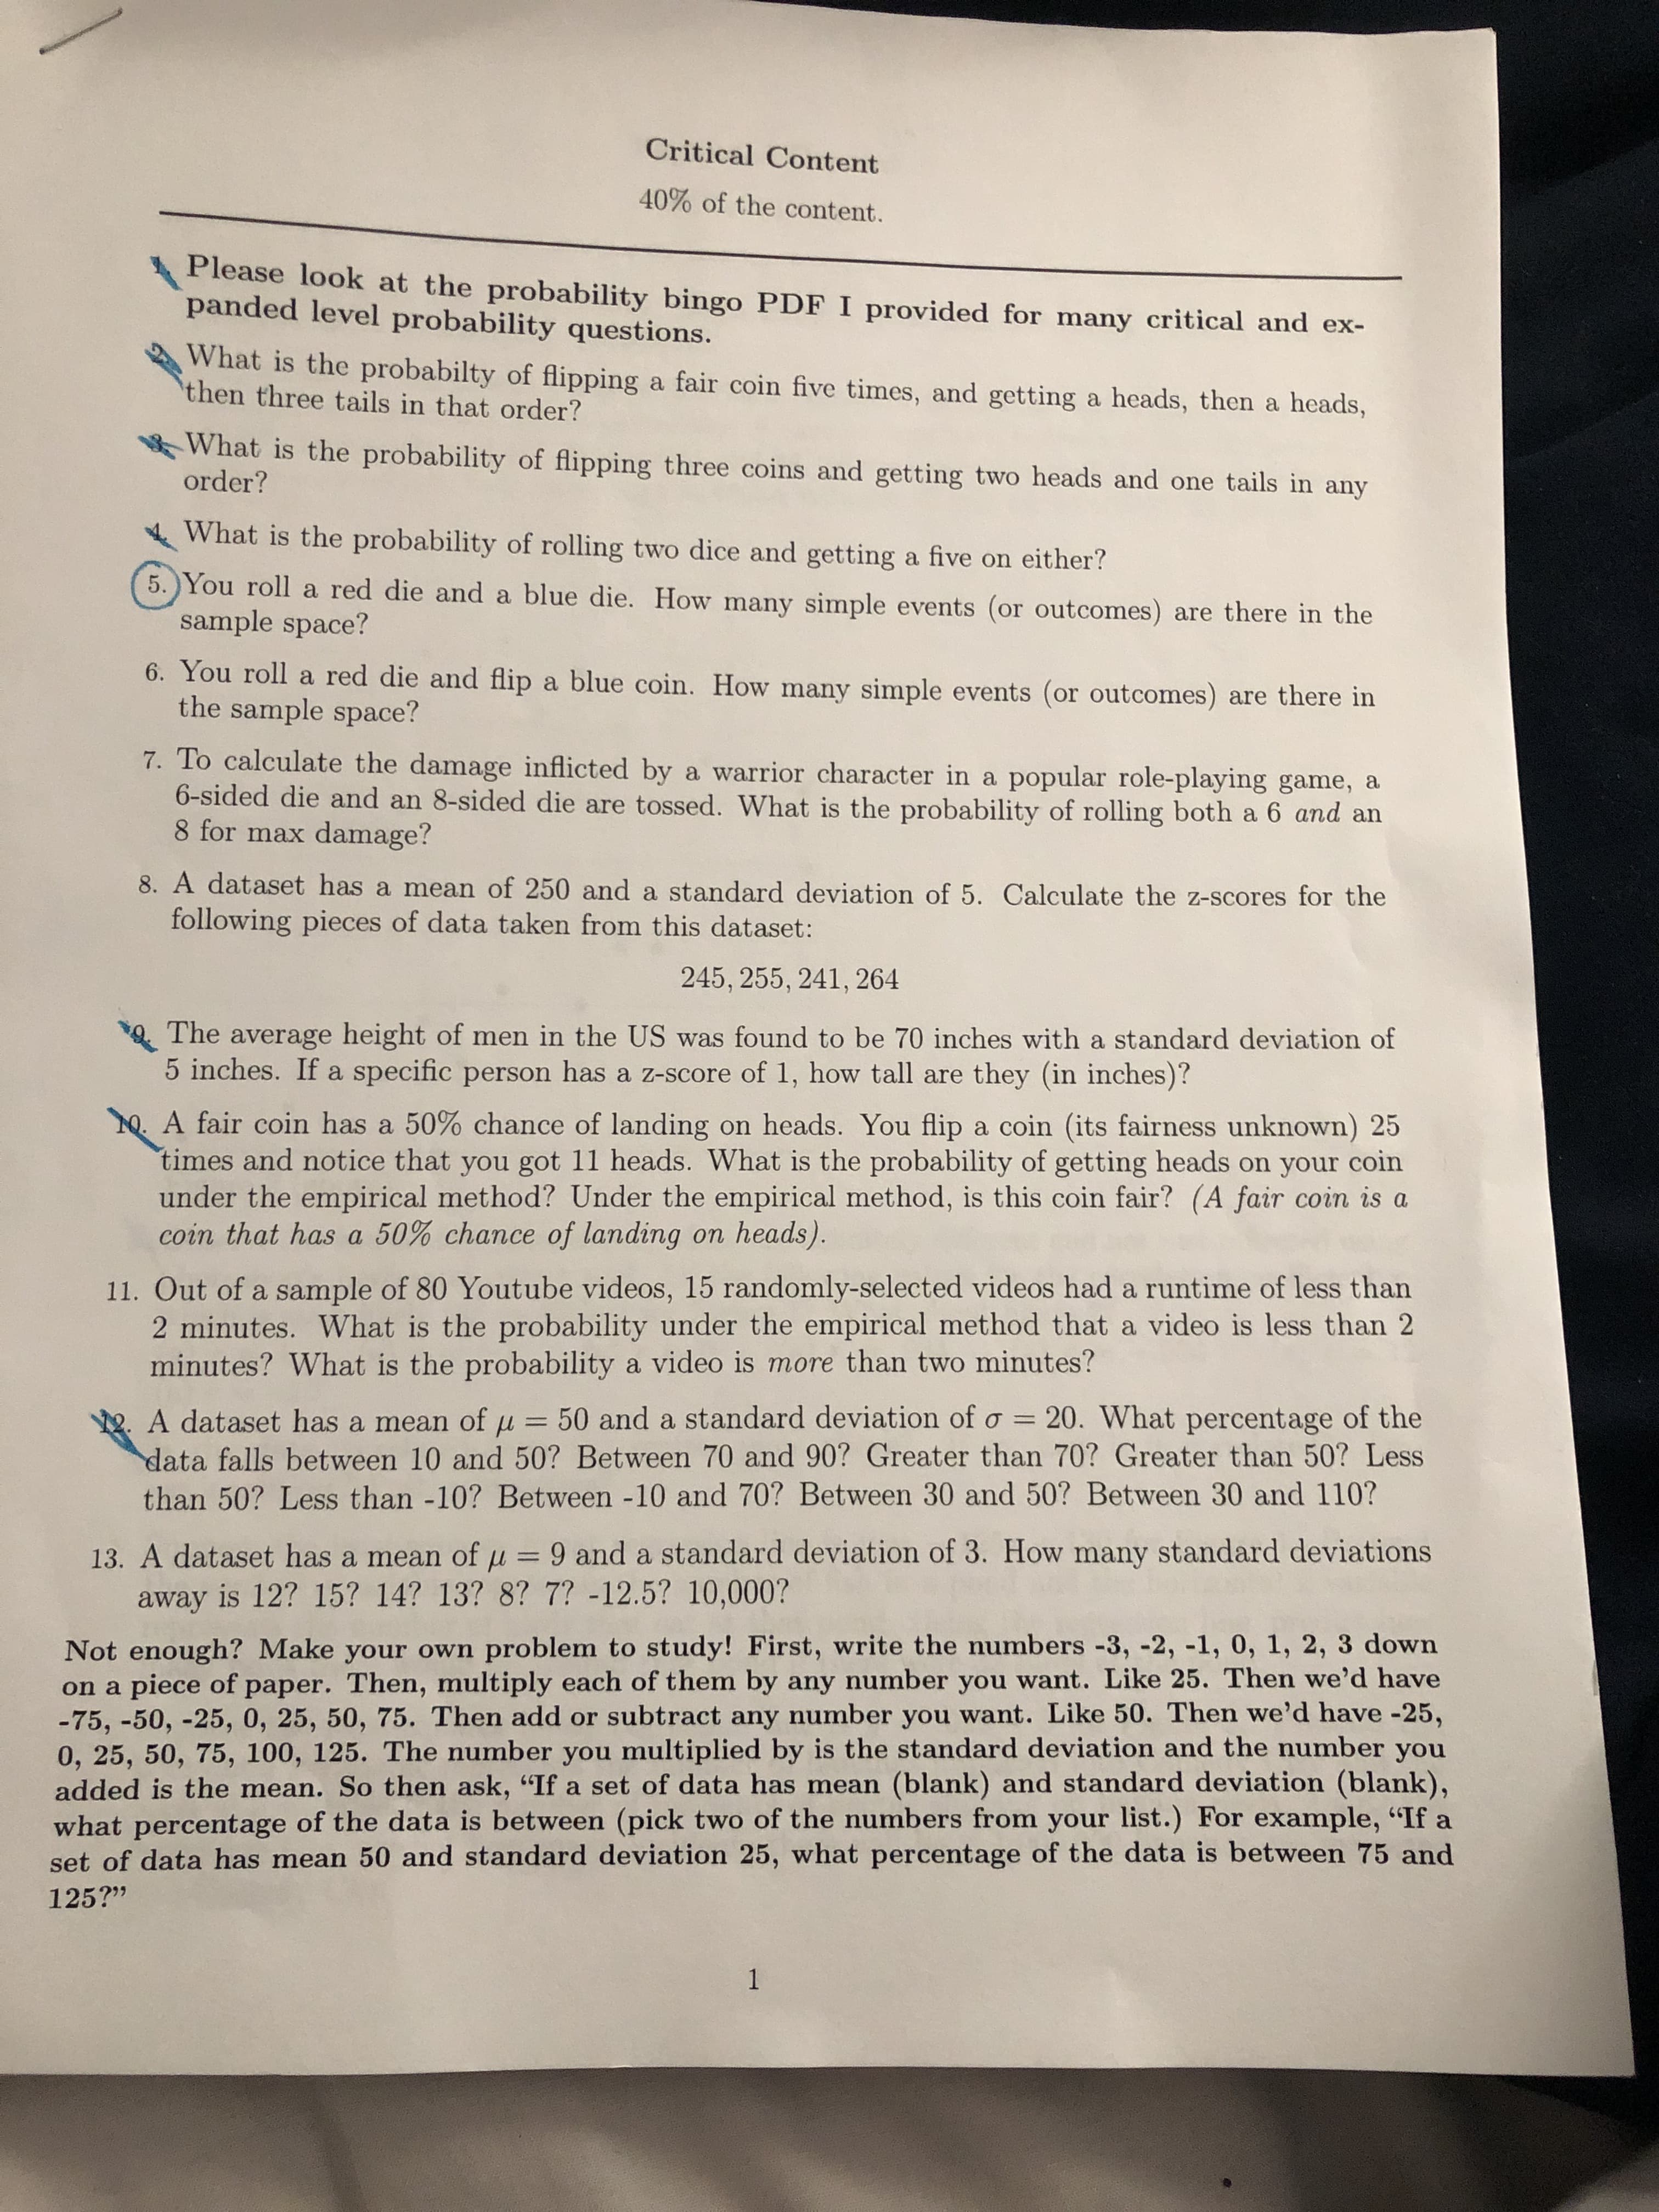
Critical Content 40% of the content. Please look at the probability bingo PDF I provided for many critical and ex- panded level probability questions. What is the probabilty of flipping a fair coin five times, and getting a heads, then a heads, then three tails in that order? What is the probability of flipping three coins and getting two heads and one tails in any order? What is the probability of rolling two dice and getting a five on either? 5. You roll a red die and a blue die. How many simple events (or outcomes) are there in the sample space? 6. You roll a red die and flip a blue coin. How many simple events (or outcomes) are there in the sample space? 7. To calculate the damage inflicted by a warrior character in a popular role-playing game, a 6-sided die and an 8-sided die are tossed. What is the probability of rolling both a 6 and an 8 for max damage? 8. A dataset has a mean of 250 and a standard deviation of 5. Calculate the z-scores for the following pieces of data taken from this dataset: 245, 255, 241, 264 The average height of men in the US was found to be 70 inches with a standard deviation of 5 inches. If a specific person has a z-score of 1, how tall are they (in inches)? 0. A fair coin has a 50% chance of landing on heads. You flip a coin (its fairness unknown) 25 times and notice that you got 11 heads. What is the probability of getting heads on your coin under the empirical method? Under the empirical method, is this coin fair? (A fair coin is a coin that has a 50% chance of landing on heads). 11. Out of a sample of 80 Youtube videos, 15 randomly-selected videos had a runtime of less than 2 minutes. What is the probability under the empirical method that a video is less than 2 minutes? What is the probability a video is more than two minutes? A dataset has a mean of u = 50 and a standard deviation of o = 20. What percentage of the data falls between 10 and 50? Between 70 and 90? Greater than 70? Greater than 50? Less than 50? Less than -10? Between -10 and 70? Between 30 and 50? Between 30 and 110? %3D 13. A dataset has a mean of u = 9 and a standard deviation of 3. How many standard deviations away is 12? 15? 14? 13? 8? 7? -12.5? 10,000? %3D Not enough? Make your own problem to study! First, write the numbers -3, -2, -1, 0, 1, 2, 3 down on a piece of paper. Then, multiply each of them by any number you want. Like 25. Then we'd have -75, -50, -25, 0, 25, 50, 75. Then add or subtract any number you want. Like 50. Then we'd have -25, 0, 25, 50, 75, 100, 125. The number you multiplied by is the standard deviation and the number you added is the mean. So then ask, "If a set of data has mean (blank) and standard deviation (blank), what percentage of the data is between (pick two of the numbers from your list.) For example, "If a set of data has mean 50 and standard deviation 25, what percentage of the data is between 75 and 125?"


Percentage
A percentage is a number indicated as a fraction of 100. It is a dimensionless number often expressed using the symbol %.
Algebraic Expressions
In mathematics, an algebraic expression consists of constant(s), variable(s), and mathematical operators. It is made up of terms.
Numbers
Numbers are some measures used for counting. They can be compared one with another to know its position in the number line and determine which one is greater or lesser than the other.
Subtraction
Before we begin to understand the subtraction of algebraic expressions, we need to list out a few things that form the basis of algebra.
Addition
Before we begin to understand the addition of algebraic expressions, we need to list out a few things that form the basis of algebra.
Can I have the answer to 8?

Step by step
Solved in 2 steps with 2 images


