Cullumber Company Balance Sheets December 31 Assets 2020 2019 Cullumber Company $ 64,000 $ 70,000 Cash Income Statements 53,000 Debt investments (short-term) 39,000 For the Years Ended December 31 Accounts receivable 108,000 90,000 2020 2019 Inventory 229,000 162,000 Sales revenue $890,000 $786,000 Prepaid expenses 30,000 25,000 641,000 Cost of goods sold 575,000 Land 130,000 130,000 Gross profit 249,000 211,000 Building and equipment (net) 264,000 185,000 194,000 Operating expenses 159,000 $884,000 $695,000 Total assets $ 55,000 $ 52,000 Net income Liabilities and Stockholders' Equity Additional information: $172,000 $102,000 Notes payable 65,000 Accounts payable 51,000 Inventory at the beginning of 2019 was $116,000. 1. Accrued liabilities 41,000 41,000 Accounts receivable (net) at the beginning of 2019 were $90,000. 2. Bonds payable, due 2023 250,000 172,000 Total assets at the beginning of 2019 were $642,000. 3. Common stock, $10 par 202,000 202,000 No common stock transactions occurred during 2019 or 2020. 4. 154,000 Retained earnings 127,000 All sales were on account. 5. $884,000 $695,000 Total liabilities and stockholders' equity Compute the liquidity and profitability ratios of Cullumber Company for 2019 and 2020. (Round all answers to 2 decimal places, e.g. 1.83 or 1.83%. If % change is a decrease show the numbers as negative, e.g. -1.83% or (1.83%).) 2019 % Change 2020 LIQUIDITY Current ratio 1.76 :1 -10.02 % 1.96 :1 Accounts receivables turnover 8.99 times 8.73 times 2.94 % 3.28 times Inventory turnover 4.14 times -20.74 % % Change 2019 2020 PROFITABILITY Profit margin 6.62 % 6.18 % -6.59 % Asset turnover 1.18 times -4.12 % 1.13 times Return on assets 6.97 % 7.78 % -10.41 % Earnings per share %$1 5.77 % 2.72 2.57 (b) The following are three independent situations and a ratio that may be affected. For each situation, compute the affected ratio (1) as of December 31, 2020, and (2) as of December 31, 2021, after giving effect to the situation. (Round all answers to 2 decimal places, e.g. 1.83 or 1.83%. If % change is a decrease show the numbers as negative, e.g. -1.83% or (1.83%).) Situation Ratio 18,000 shares of common stock were sold at par on July 1, 2021. Net income for 2021 was $53,000. Return on common stockholders' 1. equity Debt to assets ratio All of the notes payable were paid in 2021. All other liabilities remained at their December 31, 2020, levels. At December 31, 2021, total assets were $904,000. 2. The market price of common stock was $9.00 and $13.00 on December 31, 2020 and 2021, respectively. Net income for 2021 was $53,000. Price-earnings ratio 3. % Change 2020 2021 х Return on common stockholders' equity 15.45 % 13.87 1.58 Debt to assets ratio 34.07:% 59.73 % 39.38 % Price earnings ratio 3.31 times 4.78 times -44.41%
Cullumber Company Balance Sheets December 31 Assets 2020 2019 Cullumber Company $ 64,000 $ 70,000 Cash Income Statements 53,000 Debt investments (short-term) 39,000 For the Years Ended December 31 Accounts receivable 108,000 90,000 2020 2019 Inventory 229,000 162,000 Sales revenue $890,000 $786,000 Prepaid expenses 30,000 25,000 641,000 Cost of goods sold 575,000 Land 130,000 130,000 Gross profit 249,000 211,000 Building and equipment (net) 264,000 185,000 194,000 Operating expenses 159,000 $884,000 $695,000 Total assets $ 55,000 $ 52,000 Net income Liabilities and Stockholders' Equity Additional information: $172,000 $102,000 Notes payable 65,000 Accounts payable 51,000 Inventory at the beginning of 2019 was $116,000. 1. Accrued liabilities 41,000 41,000 Accounts receivable (net) at the beginning of 2019 were $90,000. 2. Bonds payable, due 2023 250,000 172,000 Total assets at the beginning of 2019 were $642,000. 3. Common stock, $10 par 202,000 202,000 No common stock transactions occurred during 2019 or 2020. 4. 154,000 Retained earnings 127,000 All sales were on account. 5. $884,000 $695,000 Total liabilities and stockholders' equity Compute the liquidity and profitability ratios of Cullumber Company for 2019 and 2020. (Round all answers to 2 decimal places, e.g. 1.83 or 1.83%. If % change is a decrease show the numbers as negative, e.g. -1.83% or (1.83%).) 2019 % Change 2020 LIQUIDITY Current ratio 1.76 :1 -10.02 % 1.96 :1 Accounts receivables turnover 8.99 times 8.73 times 2.94 % 3.28 times Inventory turnover 4.14 times -20.74 % % Change 2019 2020 PROFITABILITY Profit margin 6.62 % 6.18 % -6.59 % Asset turnover 1.18 times -4.12 % 1.13 times Return on assets 6.97 % 7.78 % -10.41 % Earnings per share %$1 5.77 % 2.72 2.57 (b) The following are three independent situations and a ratio that may be affected. For each situation, compute the affected ratio (1) as of December 31, 2020, and (2) as of December 31, 2021, after giving effect to the situation. (Round all answers to 2 decimal places, e.g. 1.83 or 1.83%. If % change is a decrease show the numbers as negative, e.g. -1.83% or (1.83%).) Situation Ratio 18,000 shares of common stock were sold at par on July 1, 2021. Net income for 2021 was $53,000. Return on common stockholders' 1. equity Debt to assets ratio All of the notes payable were paid in 2021. All other liabilities remained at their December 31, 2020, levels. At December 31, 2021, total assets were $904,000. 2. The market price of common stock was $9.00 and $13.00 on December 31, 2020 and 2021, respectively. Net income for 2021 was $53,000. Price-earnings ratio 3. % Change 2020 2021 х Return on common stockholders' equity 15.45 % 13.87 1.58 Debt to assets ratio 34.07:% 59.73 % 39.38 % Price earnings ratio 3.31 times 4.78 times -44.41%

Financial & Managerial Accounting
13th Edition
ISBN:9781285866307
Author:Carl Warren, James M. Reeve, Jonathan Duchac
Publisher:Carl Warren, James M. Reeve, Jonathan Duchac
Chapter15: Financial Statement Analysis
Section: Chapter Questions
Problem 15.17EX: Profitability ratios The following selected data were taken from the financial statements of...

Related questions
Question
100%
Accounting. Please help
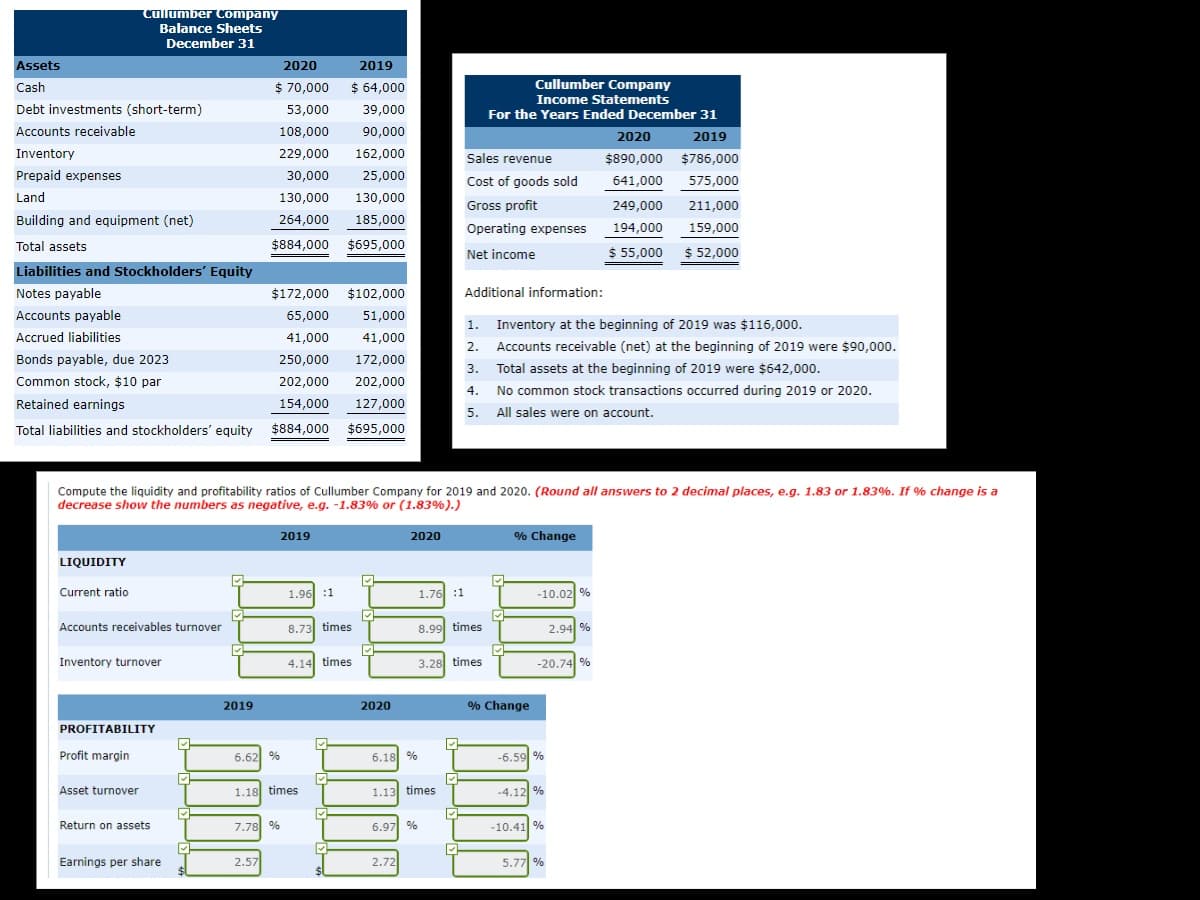
Transcribed Image Text:Cullumber Company
Balance Sheets
December 31
Assets
2020
2019
Cullumber Company
$ 64,000
$ 70,000
Cash
Income Statements
53,000
Debt investments (short-term)
39,000
For the Years Ended December 31
Accounts receivable
108,000
90,000
2020
2019
Inventory
229,000
162,000
Sales revenue
$890,000 $786,000
Prepaid expenses
30,000
25,000
641,000
Cost of goods sold
575,000
Land
130,000
130,000
Gross profit
249,000
211,000
Building and equipment (net)
264,000
185,000
194,000
Operating expenses
159,000
$884,000 $695,000
Total assets
$ 55,000
$ 52,000
Net income
Liabilities and Stockholders' Equity
Additional information:
$172,000 $102,000
Notes payable
65,000
Accounts payable
51,000
Inventory at the beginning of 2019 was $116,000.
1.
Accrued liabilities
41,000
41,000
Accounts receivable (net) at the beginning of 2019 were $90,000.
2.
Bonds payable, due 2023
250,000
172,000
Total assets at the beginning of 2019 were $642,000.
3.
Common stock, $10 par
202,000
202,000
No common stock transactions occurred during 2019 or 2020.
4.
154,000
Retained earnings
127,000
All sales were on account.
5.
$884,000
$695,000
Total liabilities and stockholders' equity
Compute the liquidity and profitability ratios of Cullumber Company for 2019 and 2020. (Round all answers to 2 decimal places, e.g. 1.83 or 1.83%. If % change is a
decrease show the numbers as negative, e.g. -1.83% or (1.83%).)
2019
% Change
2020
LIQUIDITY
Current ratio
1.76 :1
-10.02 %
1.96 :1
Accounts receivables turnover
8.99 times
8.73 times
2.94 %
3.28 times
Inventory turnover
4.14 times
-20.74 %
% Change
2019
2020
PROFITABILITY
Profit margin
6.62 %
6.18 %
-6.59 %
Asset turnover
1.18 times
-4.12 %
1.13 times
Return on assets
6.97 %
7.78 %
-10.41 %
Earnings per share
%$1
5.77 %
2.72
2.57
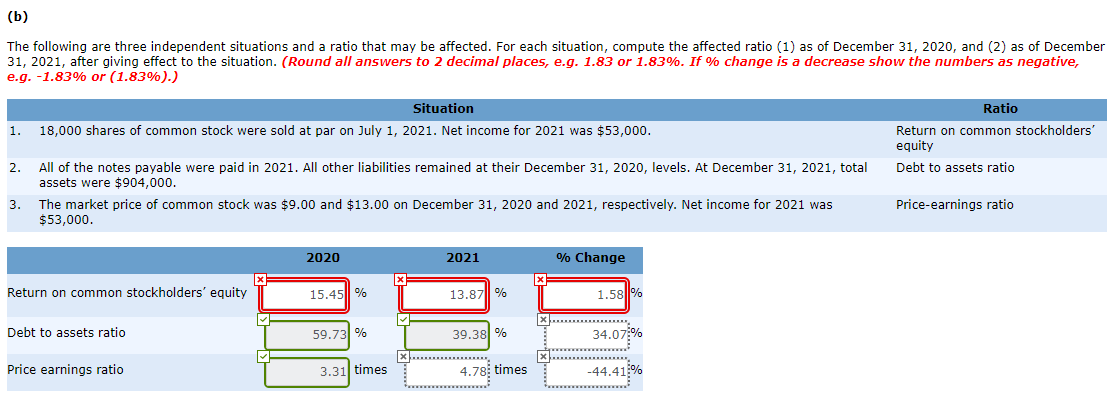
Transcribed Image Text:(b)
The following are three independent situations and a ratio that may be affected. For each situation, compute the affected ratio (1) as of December 31, 2020, and (2) as of December
31, 2021, after giving effect to the situation. (Round all answers to 2 decimal places, e.g. 1.83 or 1.83%. If % change is a decrease show the numbers as negative,
e.g. -1.83% or (1.83%).)
Situation
Ratio
18,000 shares of common stock were sold at par on July 1, 2021. Net income for 2021 was $53,000.
Return on common stockholders'
1.
equity
Debt to assets ratio
All of the notes payable were paid in 2021. All other liabilities remained at their December 31, 2020, levels. At December 31, 2021, total
assets were $904,000.
2.
The market price of common stock was $9.00 and $13.00 on December 31, 2020 and 2021, respectively. Net income for 2021 was
$53,000.
Price-earnings ratio
3.
% Change
2020
2021
х
Return on common stockholders' equity
15.45 %
13.87
1.58
Debt to assets ratio
34.07:%
59.73 %
39.38 %
Price earnings ratio
3.31 times
4.78 times
-44.41%
Expert Solution
This question has been solved!
Explore an expertly crafted, step-by-step solution for a thorough understanding of key concepts.

This is a popular solution!

Trending now
This is a popular solution!

Step by step
Solved in 3 steps with 3 images

Knowledge Booster


Learn more about
Need a deep-dive on the concept behind this application? Look no further. Learn more about this topic, accounting and related others by exploring similar questions and additional content below.Recommended textbooks for you
Financial & Managerial Accounting
Accounting
ISBN:
9781285866307
Author:
Carl Warren, James M. Reeve, Jonathan Duchac
Publisher:
Cengage Learning

Corporate Financial Accounting
Accounting
ISBN:
9781337398169
Author:
Carl Warren, Jeff Jones
Publisher:
Cengage Learning

Survey of Accounting (Accounting I)
Accounting
ISBN:
9781305961883
Author:
Carl Warren
Publisher:
Cengage Learning
Financial & Managerial Accounting
Accounting
ISBN:
9781285866307
Author:
Carl Warren, James M. Reeve, Jonathan Duchac
Publisher:
Cengage Learning
Corporate Financial Accounting
Accounting
ISBN:
9781337398169
Author:
Carl Warren, Jeff Jones
Publisher:
Cengage Learning
Survey of Accounting (Accounting I)
Accounting
ISBN:
9781305961883
Author:
Carl Warren
Publisher:
Cengage Learning