d 50 tec Question -2) Completed forms from a particular department of a mortgage company were sampled daily to check the performance quality of that department. One sample of 50 units was collected each day for 20 days, with these results: Determine center line, upper and lower control limit for P chart and determine whether process is under control or not. Sample # Sample size 50 50 50 50 50 50 50 50 50 50 50 50 50 50 50 50 50 50 50 50 1 2 3 4 5 6 9 7 8 10 11 12 13 14 15 16 17 18 19 20 Total Number of defect 4 2 1 0 5 6 5 3 2 1 4 5 6 2 3 0 4 2 1 5 61 P-chart for attribute when asked for whether under Convol 3 we know its x & R large in Sloots mans 30 want to do the Co #of In formula for LELE 3 Sp= Standard deviation
d 50 tec Question -2) Completed forms from a particular department of a mortgage company were sampled daily to check the performance quality of that department. One sample of 50 units was collected each day for 20 days, with these results: Determine center line, upper and lower control limit for P chart and determine whether process is under control or not. Sample # Sample size 50 50 50 50 50 50 50 50 50 50 50 50 50 50 50 50 50 50 50 50 1 2 3 4 5 6 9 7 8 10 11 12 13 14 15 16 17 18 19 20 Total Number of defect 4 2 1 0 5 6 5 3 2 1 4 5 6 2 3 0 4 2 1 5 61 P-chart for attribute when asked for whether under Convol 3 we know its x & R large in Sloots mans 30 want to do the Co #of In formula for LELE 3 Sp= Standard deviation

Practical Management Science
6th Edition
ISBN:9781337406659
Author:WINSTON, Wayne L.
Publisher:WINSTON, Wayne L.
Chapter2: Introduction To Spreadsheet Modeling
Section: Chapter Questions
Problem 20P: Julie James is opening a lemonade stand. She believes the fixed cost per week of running the stand...

Related questions
Question
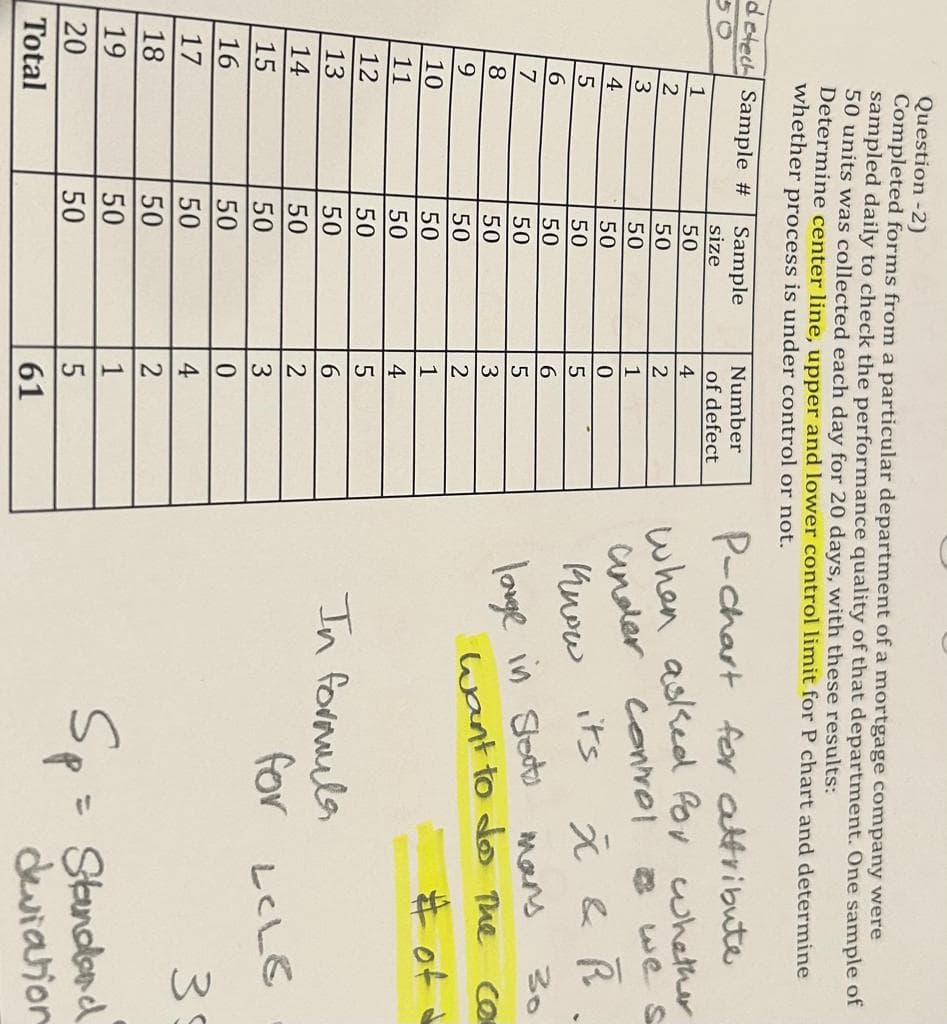
Transcribed Image Text:Question -2)
Completed forms from a particular department of a mortgage company were
sampled daily to check the performance quality of that department. One sample of
50 units was collected each day for 20 days, with these results:
Determine center line, upper and lower control limit for P chart and determine
whether process is under control or not.
dete Sample #
1
2
3
4
5
6
7
8
9
10
11
12
13
14
15
16
17
18
19
20
Total
Sample
size
50
50
50
50
50
50
50
50
50
50
50
50
50
50
50
50
50
50
50
50
Number
of defect
4
2
1
0
5
6
5
3
2
1
4
5
6
2
3
0
4
2
1
5
61
P-chart for attribute
asked for whether
we s
when
under convol
Кного
its
large in Sloots
In formula
for
X & R
mans
Sp=
want to do the co
D
30
# of d
LCLE
39
= Standard
deviation
Expert Solution
This question has been solved!
Explore an expertly crafted, step-by-step solution for a thorough understanding of key concepts.

This is a popular solution!

Trending now
This is a popular solution!

Step by step
Solved in 3 steps with 4 images

Recommended textbooks for you
Practical Management Science
Operations Management
ISBN:
9781337406659
Author:
WINSTON, Wayne L.
Publisher:
Cengage,

Operations Management
Operations Management
ISBN:
9781259667473
Author:
William J Stevenson
Publisher:
McGraw-Hill Education

Operations and Supply Chain Management (Mcgraw-hi…
Operations Management
ISBN:
9781259666100
Author:
F. Robert Jacobs, Richard B Chase
Publisher:
McGraw-Hill Education
Practical Management Science
Operations Management
ISBN:
9781337406659
Author:
WINSTON, Wayne L.
Publisher:
Cengage,
Operations Management
Operations Management
ISBN:
9781259667473
Author:
William J Stevenson
Publisher:
McGraw-Hill Education
Operations and Supply Chain Management (Mcgraw-hi…
Operations Management
ISBN:
9781259666100
Author:
F. Robert Jacobs, Richard B Chase
Publisher:
McGraw-Hill Education


Purchasing and Supply Chain Management
Operations Management
ISBN:
9781285869681
Author:
Robert M. Monczka, Robert B. Handfield, Larry C. Giunipero, James L. Patterson
Publisher:
Cengage Learning

Production and Operations Analysis, Seventh Editi…
Operations Management
ISBN:
9781478623069
Author:
Steven Nahmias, Tava Lennon Olsen
Publisher:
Waveland Press, Inc.