(d) Compute the relative class frequency fin for each class in Table 2-9 and complete the partial relative-frequency histogram in Figure 2-6. TABLE 2-9 Relative Class Frequency Class 1-3 46 7-9 10-12 FIGURE 2-6 Relative frequency 0.4 03- 02+ fin 3/40-0.075 15/40-0.375 0.5 3.5 6.5 9.5 12.5 15.5 Minutes TABLE 2-10 Completion of Table 2-9 Class 1-3 46 7-9 10-12 13-15 FIGURE 2-7 Completion of Figure 26 0.4 Relative frequency n 0.3 02+ 0.5 3.5 6.5 9.5 12.5 15.5 Minutes fin 0.075 0.375 0.425 0.100 0.025
(d) Compute the relative class frequency fin for each class in Table 2-9 and complete the partial relative-frequency histogram in Figure 2-6. TABLE 2-9 Relative Class Frequency Class 1-3 46 7-9 10-12 FIGURE 2-6 Relative frequency 0.4 03- 02+ fin 3/40-0.075 15/40-0.375 0.5 3.5 6.5 9.5 12.5 15.5 Minutes TABLE 2-10 Completion of Table 2-9 Class 1-3 46 7-9 10-12 13-15 FIGURE 2-7 Completion of Figure 26 0.4 Relative frequency n 0.3 02+ 0.5 3.5 6.5 9.5 12.5 15.5 Minutes fin 0.075 0.375 0.425 0.100 0.025

Algebra & Trigonometry with Analytic Geometry
13th Edition
ISBN:9781133382119
Author:Swokowski
Publisher:Swokowski
Chapter5: Inverse, Exponential, And Logarithmic Functions
Section5.6: Exponential And Logarithmic Equations
Problem 68E

Related questions
Question
Please answer part d. Show work! Thanks.
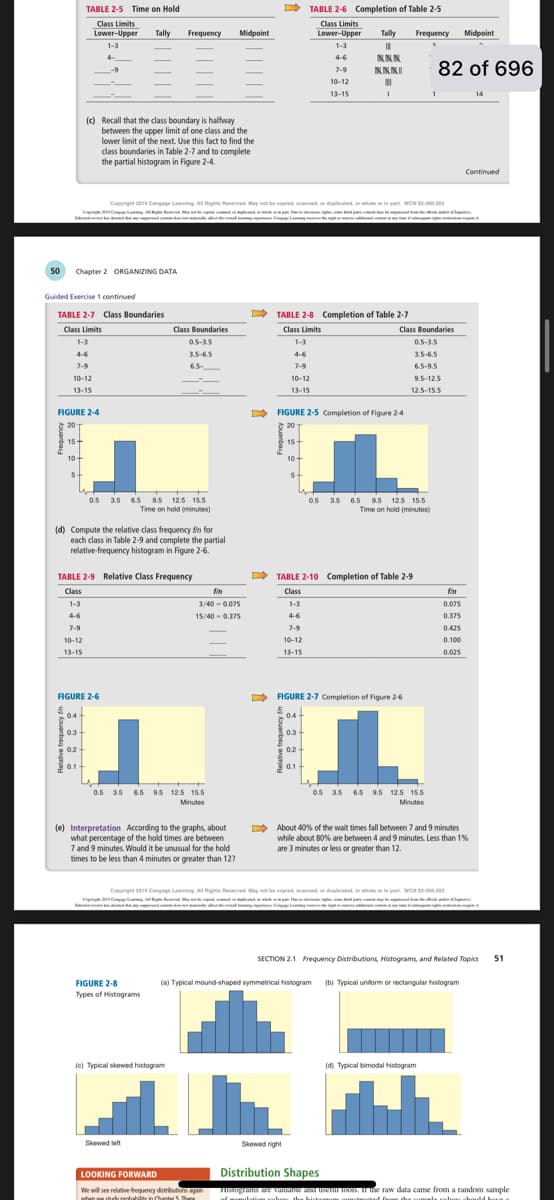
Transcribed Image Text:50 Chapter 2 ORGANIZING DATA
Guided Exercise 1 continued
TABLE 2-7 Class Boundaries
Class Limits
15-
1-3
4-6
7-9
10-12
13-15
TABLE 2-5 Time on Hold
Class Limits
Lower-Upper Tally Frequency
1-3
FIGURE 2-4
20
10+
5
(c) Recall that the class boundary is halfway
between the upper limit of one class and the
lower limit of the next. Use this fact to find the
class boundaries in Table 2-7 and to complete
the partial histogram in Figure 2-4.
10-12
13-15
0.3
(d) Compute the relative class frequency fin for
each class in Table 2-9 and complete the partial
relative-frequency histogram in Figure 2-6.
0.2
TABLE 2-9 Relative Class Frequency
Class
1-3
4-6
7-9
0.1
Copyright 2019 Cengage Learning. All Rights Reserved. May not be copied, scanned, or duplicated, in whole or in part. WCN 03-200-303
CoCo Ling All Rights Reserved. Maybe indepline, in whole or in participache preved from the clock and Ch
that any vapproved content marily affect the dig p Copa Leaning the right to al com
FIGURE 2-6
0.4+
0.5 3.5 6.5 9.5 12.5 15.5
Time on hold (minutes)
Class Boundaries
0.5-3.5
3.5-6.5
6.5
0.5 3.5 6.5 9.5 12.5 15.5
Minutes
(e) Interpretation According to the graphs, about
wwww
what percentage of the hold times are between
7 and 9 minutes. Would it be unusual for the hold
times to be less than 4 minutes or greater than 127
FIGURE 2-8
Types of Histograms
Midpoint
fin
3/40-0.075
15/40 -0.375
(c) Typical skewed histogram
Skewed left
D
LOOKING FORWARD
We will see relative-frequency distributions again
when we studynerability in Chan Th
1-3
4-6
7-9
10-12
13-15
TABLE 2-8 Completion of Table 2-7
Class Limits
15
10
TABLE 2-6 Completion of Table 2-5
Class Limits
Lower-Upper
1-3
4-6
5+
FIGURE 2-5 Completion of Figure 2-4
20
7-9
10-12
13-15
7-9
10-12
13-15
Tally Frequency Midpoint
III
>
NNN
Skewed right
NI
II
I
0.3
0.2
0.1
TABLE 2-10 Completion of Table 2-9
Class
1-3
4-6
FIGURE 2-7 Completion of Figure 2-6
0.4
Class Boundaries
0.5 3.5 6.5 9.5 12.5 15.5
Time on hold (minutes)
1
0.5-3.5
3.5-6.5
6.5-9.5
9.5-12.5
12.5-15.5
82 of 696
0.5 3.5 6.5 9.5 12.5 15.5
Minutes
Copyright 2019 Cengage Learning. All Rights Reserved. May not be copied, scanned, or duplicated, in whole or in part WCN 03-200-203
fin
0.075
0.375
0.425
0.100
0.025
About 40% of the wait times fall between 7 and 9 minutes
while about 80% are between 4 and 9 minutes. Less than 1%
are 3 minutes or less or greater than 12.
(a) Typical mound-shaped symmetrical histogram (b) Typical uniform or rectangular histogram
(d) Typical bimodal histogram
SECTION 2.1 Frequency Distributions, Histograms, and Related Topics
14
Continued
51
Distribution Shapes
Histograms are valuable and useful tools, in the raw data came from a random sample
of monulation soluas the histoamm nonstossted fo the compla voluas should have a
If
Expert Solution
This question has been solved!
Explore an expertly crafted, step-by-step solution for a thorough understanding of key concepts.

Step by step
Solved in 6 steps with 1 images

Recommended textbooks for you
Algebra & Trigonometry with Analytic Geometry
Algebra
ISBN:
9781133382119
Author:
Swokowski
Publisher:
Cengage
Algebra & Trigonometry with Analytic Geometry
Algebra
ISBN:
9781133382119
Author:
Swokowski
Publisher:
Cengage