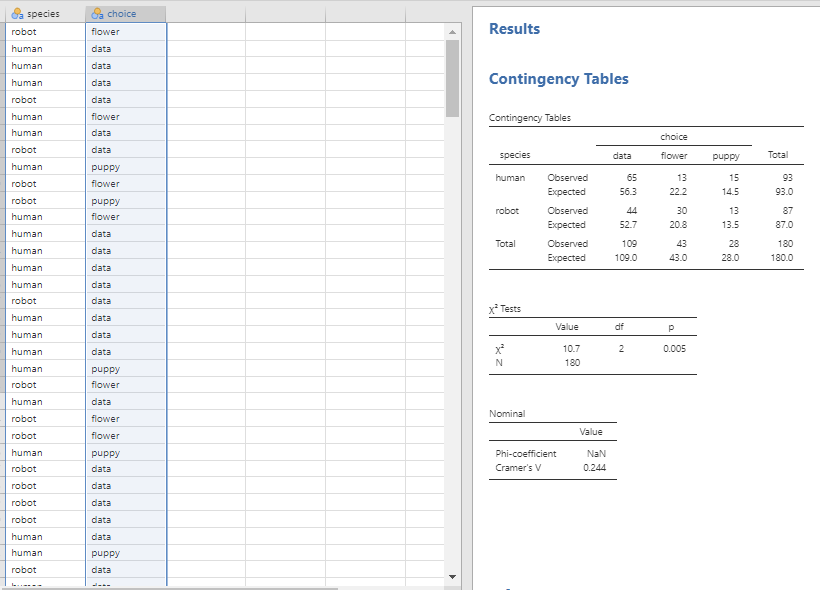
Danielle Navarro tells the story of: ... watching an animated documentary examining the quaint customs of the natives of the planet Chapek 9. Apparently, in order to gain access to their capital city a visitor must prove that they’re a robot, not a human. In order to determine whether or not a visitor is human, the natives ask whether the visitor prefers puppies, flowers, or large, properly formatted data files. “Pretty clever,” I thought to myself “but what if humans and robots have the same preferences? That probably wouldn’t be a very good test then, would it?” As it happens, I got my hands on the testing data that the civil authorities of Chapek 9 used to check this. It turns out that what they did was very simple. They found a bunch of robots and a bunch of humans and asked them what they preferred. I saved their data in a file called chapek9.csv .... In total there are 180 entries in the data set, one for each person (counting both robots and humans as “people”) who was asked to make a choice. So if there are reliable differences between how robots and humans answer this question, then the question may be useful for deciding who can enter the city. We can conduct a chi-square test of independence to evaluate the extent to which the categories of species and type of answer are independent. Using the image of the statistical hypothesis test results : Chi-Square Test for Independence (1) Were the results statistically significant? How can you tell? (2) Could these results be used to improve guards’ decisions about whether to allow someone to enter the city? Explain your answer. (3) For each answer (data, flower, or puppy) given by someone wanting to enter the city, what should the guards’ decision be? Explain your answers.
... watching an animated documentary examining the quaint customs of the natives of the planet Chapek 9. Apparently, in order to gain access to their capital city a visitor must prove that they’re a robot, not a human. In order to determine whether or not a visitor is human, the natives ask whether the visitor prefers puppies, flowers, or large, properly formatted data files. “Pretty clever,” I thought to myself “but what if humans and robots have the same preferences? That probably wouldn’t be a very good test then, would it?” As it happens, I got my hands on the testing data that the civil authorities of Chapek 9 used to check this. It turns out that what they did was very simple. They found a bunch of robots and a bunch of humans and asked them what they preferred. I saved their data in a file called chapek9.csv .... In total there are 180 entries in the data set, one for each person (counting both robots and humans as “people”) who was asked to make a choice.
(1) Were the results statistically significant? How can you tell?
(2) Could these results be used to improve guards’ decisions about whether to allow someone to enter the city? Explain your answer.
(3) For each answer (data, flower, or puppy) given by someone wanting to enter the city, what should the guards’ decision be? Explain your answers.
(4) As measured by Cramer’s V, is the effect size small, medium, or large?

Step by step
Solved in 2 steps


