Data on residential energy consumption per capita (measured in million BTU) had a mean of 70.8 and a standard deviation of 7.3 for the states east of the Mississippi River. Assume that the distribution of residential energy use is approximately unimodal and symmetric. Complete parts (a) through (d) below. a. Between which two values would you expect to find approximately the middle 68% of the per capita energy consumption rates? Between and million BTU (Round to one decimal place as needed. Use ascending order.) b. Between which two values would you expect to find approximately the middle 95% of the per capita energy consumption rates? Between and million BTU (Round to one decimal place as needed. Use ascending order.) c. If an eastern state had a per capita residential energy consumption rate of 54.5 million BTU, would this be considered unusual? Explain. O A. No, because 54.5 million BTU is more than two standard deviations from the mean. O B. No, because 54.5 million BTU is not more than two standard deviations from the mean. O C. Yes, because 54.5 million BTU is more than two standard deviations from the mean. O D. Yes, because 54.5 million BTU is not more than two standard deviations from the mean. d. Vermont had a per capita residential energy consumption rate of 61.6 million BTU, would this be considered unusually low? Explain. O A. No, because 61.6 million BTU is not more than two standard deviations below the mean. O B. Yes, because 61.6 million BTU is not more than two standard deviations below the mean. OC. No, because 61.6 million BTU is more than two standard deviations below the mean. O D. Yes, because 61.6 million BTU is more than two standard deviations below the mean.
Data on residential energy consumption per capita (measured in million BTU) had a mean of 70.8 and a standard deviation of 7.3 for the states east of the Mississippi River. Assume that the distribution of residential energy use is approximately unimodal and symmetric. Complete parts (a) through (d) below. a. Between which two values would you expect to find approximately the middle 68% of the per capita energy consumption rates? Between and million BTU (Round to one decimal place as needed. Use ascending order.) b. Between which two values would you expect to find approximately the middle 95% of the per capita energy consumption rates? Between and million BTU (Round to one decimal place as needed. Use ascending order.) c. If an eastern state had a per capita residential energy consumption rate of 54.5 million BTU, would this be considered unusual? Explain. O A. No, because 54.5 million BTU is more than two standard deviations from the mean. O B. No, because 54.5 million BTU is not more than two standard deviations from the mean. O C. Yes, because 54.5 million BTU is more than two standard deviations from the mean. O D. Yes, because 54.5 million BTU is not more than two standard deviations from the mean. d. Vermont had a per capita residential energy consumption rate of 61.6 million BTU, would this be considered unusually low? Explain. O A. No, because 61.6 million BTU is not more than two standard deviations below the mean. O B. Yes, because 61.6 million BTU is not more than two standard deviations below the mean. OC. No, because 61.6 million BTU is more than two standard deviations below the mean. O D. Yes, because 61.6 million BTU is more than two standard deviations below the mean.

MATLAB: An Introduction with Applications
6th Edition
ISBN:9781119256830
Author:Amos Gilat
Publisher:Amos Gilat
Chapter1: Starting With Matlab
Section: Chapter Questions
Problem 1P

Related questions
Question
Data on residential energy consumption per capita (measured in million BTU) had a mean of
70.8
and a standard deviation of
7.3
for the states
east of
the
Mississippi River.
Assume that the distribution of residential energy use is approximately unimodal and symmetric. Complete parts (a) through (d) below.
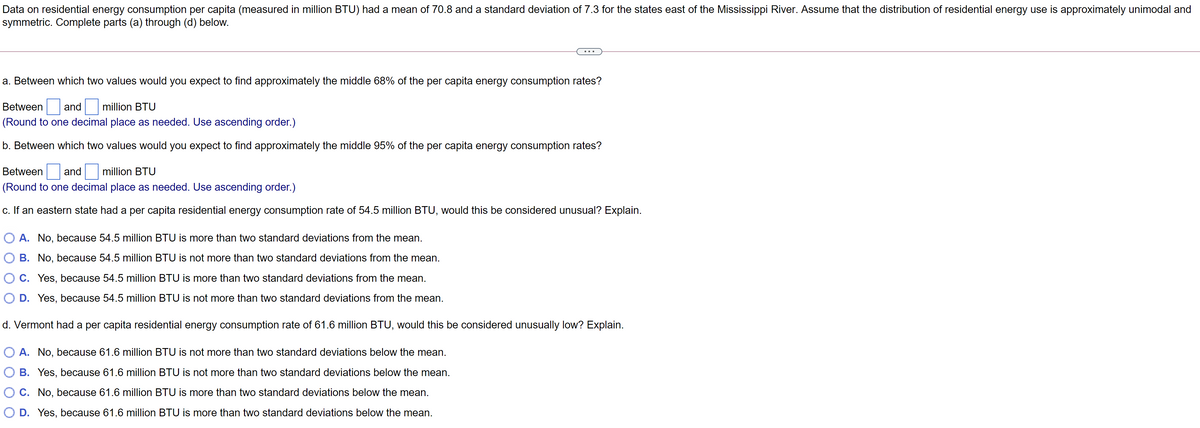
Transcribed Image Text:Data on residential energy consumption per capita (measured in million BTU) had a mean of 70.8 and a standard deviation of 7.3 for the states east of the Mississippi River. Assume that the distribution of residential energy use is approximately unimodal and
symmetric. Complete parts (a) through (d) below.
a. Between which two values would you expect to find approximately the middle 68% of the per capita energy consumption rates?
Between
and
million BTU
(Round to one decimal place as needed. Use ascending order.)
b. Between which two values would you expect to find approximately the middle 95% of the per capita energy consumption rates?
Between
and
million BTU
(Round to one decimal place as needed. Use ascending order.)
c. If an eastern state had a per capita residential energy consumption rate of 54.5 million BTU, would this be considered unusual? Explain.
O A. No, because 54.5 million BTU is more than two standard deviations from the mean.
O B. No, because 54.5 million BTU is not more than two standard deviations from the mean.
O C. Yes, because 54.5 million BTU is more than two standard deviations from the mean.
O D. Yes, because 54.5 million BTU is not more than two standard deviations from the mean.
d. Vermont had a per capita residential energy consumption rate of 61.6 million BTU, would this be considered unusually low? Explain.
O A. No, because 61.6 million BTU is not more than two standard deviations below the mean.
B. Yes, because 61.6 million BTU is not more than two standard deviations below the mean.
O C. No, because 61.6 million BTU is more than two standard deviations below the mean.
D. Yes, because 61.6 million BTU is more than two standard deviations below the mean.
Expert Solution
This question has been solved!
Explore an expertly crafted, step-by-step solution for a thorough understanding of key concepts.

This is a popular solution!

Trending now
This is a popular solution!

Step by step
Solved in 3 steps with 3 images

Recommended textbooks for you
MATLAB: An Introduction with Applications
Statistics
ISBN:
9781119256830
Author:
Amos Gilat
Publisher:
John Wiley & Sons Inc

Probability and Statistics for Engineering and th…
Statistics
ISBN:
9781305251809
Author:
Jay L. Devore
Publisher:
Cengage Learning

Statistics for The Behavioral Sciences (MindTap C…
Statistics
ISBN:
9781305504912
Author:
Frederick J Gravetter, Larry B. Wallnau
Publisher:
Cengage Learning
MATLAB: An Introduction with Applications
Statistics
ISBN:
9781119256830
Author:
Amos Gilat
Publisher:
John Wiley & Sons Inc
Probability and Statistics for Engineering and th…
Statistics
ISBN:
9781305251809
Author:
Jay L. Devore
Publisher:
Cengage Learning
Statistics for The Behavioral Sciences (MindTap C…
Statistics
ISBN:
9781305504912
Author:
Frederick J Gravetter, Larry B. Wallnau
Publisher:
Cengage Learning

Elementary Statistics: Picturing the World (7th E…
Statistics
ISBN:
9780134683416
Author:
Ron Larson, Betsy Farber
Publisher:
PEARSON

The Basic Practice of Statistics
Statistics
ISBN:
9781319042578
Author:
David S. Moore, William I. Notz, Michael A. Fligner
Publisher:
W. H. Freeman

Introduction to the Practice of Statistics
Statistics
ISBN:
9781319013387
Author:
David S. Moore, George P. McCabe, Bruce A. Craig
Publisher:
W. H. Freeman