Data on the number of hours per week of television viewing was collected on a sample of Americans. The graphs below summarize this data for two age groups. Hours Watching Television 12-17 Year-Old 18-24 Year-Old 10 12 14 16 18 20 22 24 26 28 30 32 Based on the graphs, which of the following statements is true? The Interquartile Range for the 12-17 year-old age group is greater than the 18-24 year-old age group. The Interquartile Range for the 18-24 year-old age group is less than the 12-17 year-old age group. O The Interquartile Range is the same for the 12-17 and 18-24 year-old age group. O The Interquartile Range for the 18-24 year-old age group is greater than the 12-17 year-old age group.
Data on the number of hours per week of television viewing was collected on a sample of Americans. The graphs below summarize this data for two age groups. Hours Watching Television 12-17 Year-Old 18-24 Year-Old 10 12 14 16 18 20 22 24 26 28 30 32 Based on the graphs, which of the following statements is true? The Interquartile Range for the 12-17 year-old age group is greater than the 18-24 year-old age group. The Interquartile Range for the 18-24 year-old age group is less than the 12-17 year-old age group. O The Interquartile Range is the same for the 12-17 and 18-24 year-old age group. O The Interquartile Range for the 18-24 year-old age group is greater than the 12-17 year-old age group.

Functions and Change: A Modeling Approach to College Algebra (MindTap Course List)
6th Edition
ISBN:9781337111348
Author:Bruce Crauder, Benny Evans, Alan Noell
Publisher:Bruce Crauder, Benny Evans, Alan Noell
Chapter5: A Survey Of Other Common Functions
Section5.3: Modeling Data With Power Functions
Problem 6E: Urban Travel Times Population of cities and driving times are related, as shown in the accompanying...

Related questions
Topic Video
Question
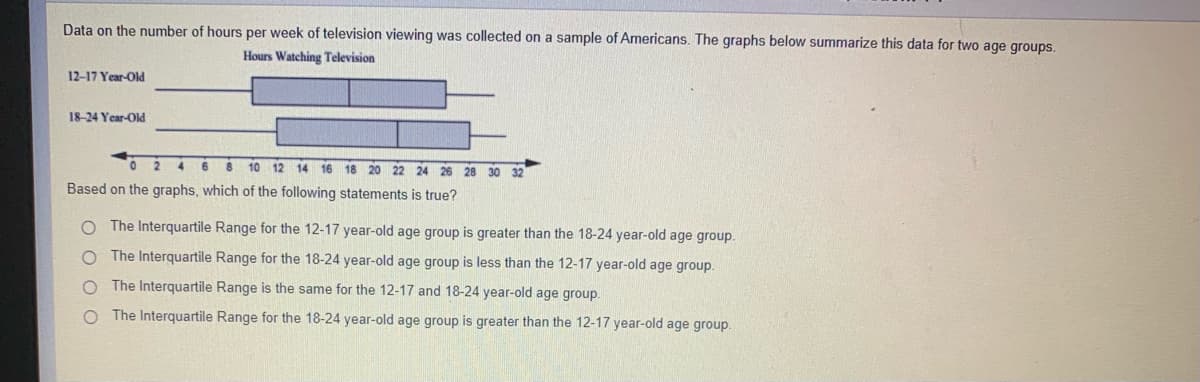
Transcribed Image Text:Data on the number of hours per week of television viewing was collected on a sample of Americans. The graphs below summarize this data for two age groups.
Hours Watching Television
12-17 Year-Old
18-24 Year-Old
10 12 14 16 18 20 22 24 26 28 30 32
Based on the graphs, which of the following statements is true?
The Interquartile Range for the 12-17 year-old age group is greater than the 18-24 year-old age group.
The Interquartile Range for the 18-24 year-old age group is less than the 12-17 year-old age group.
O The Interquartile Range is the same for the 12-17 and 18-24 year-old age group.
O The Interquartile Range for the 18-24 year-old age group is greater than the 12-17 year-old age group.
Expert Solution
This question has been solved!
Explore an expertly crafted, step-by-step solution for a thorough understanding of key concepts.

This is a popular solution!

Trending now
This is a popular solution!

Step by step
Solved in 2 steps with 2 images

Knowledge Booster


Learn more about
Need a deep-dive on the concept behind this application? Look no further. Learn more about this topic, algebra and related others by exploring similar questions and additional content below.Recommended textbooks for you
Functions and Change: A Modeling Approach to Coll…
Algebra
ISBN:
9781337111348
Author:
Bruce Crauder, Benny Evans, Alan Noell
Publisher:
Cengage Learning

Glencoe Algebra 1, Student Edition, 9780079039897…
Algebra
ISBN:
9780079039897
Author:
Carter
Publisher:
McGraw Hill

Holt Mcdougal Larson Pre-algebra: Student Edition…
Algebra
ISBN:
9780547587776
Author:
HOLT MCDOUGAL
Publisher:
HOLT MCDOUGAL
Functions and Change: A Modeling Approach to Coll…
Algebra
ISBN:
9781337111348
Author:
Bruce Crauder, Benny Evans, Alan Noell
Publisher:
Cengage Learning
Glencoe Algebra 1, Student Edition, 9780079039897…
Algebra
ISBN:
9780079039897
Author:
Carter
Publisher:
McGraw Hill
Holt Mcdougal Larson Pre-algebra: Student Edition…
Algebra
ISBN:
9780547587776
Author:
HOLT MCDOUGAL
Publisher:
HOLT MCDOUGAL