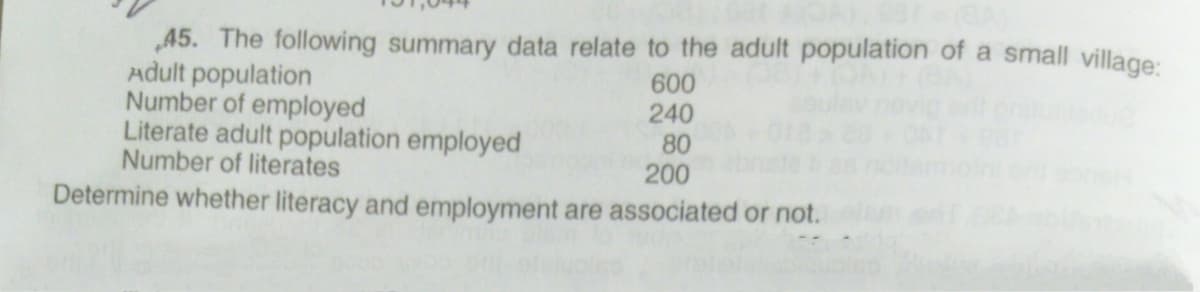
„45. The following summary data relate to the adult population of a small village: Adult population Number of employed Literate adult population employed Number of literates 600 240 80 200 Determine whether literacy and employment are associated or not.
Q: Background: Morris Saldov conducted a study in Eastern and Central Newfoundland in 1988 to examine…
A: 1. Hypotheses: H0: There is no association between knowing someone on public assistance and views on…
Q: 10 15 20 45 50 35 Age (years) Median: Click to add title Click to add title Upper Quartile: Lower…
A: To find median, quartiles, minimum, maximum, range and interquartile range
Q: A statistics instructor at a large western university would like to examine the relationship (if…
A: Answer for 1): response variable = Grade predictor variable = Problems
Q: 6 7 8 9 10 11 12 13 14 15 16 17 18 19 20 data Based on the boxplot above, identify the 5 number…
A: Boxplot
Q: :4:3. Represent the following data by a suitable diagram: Items of Expenditure Food Family A (Income…
A:
Q: The most obese countries in the world have obesity rates that range from 11.4% to 2. 74.6%. This…
A: Solution: Consider the given data. Let f : Number of countries for each class of percent Find the…
Q: 5. Below is data on car crashes of small, midsize and large cars. The load (pounds) on left and…
A: Output:
Q: 3. The electric power consumed each month by a chemical plant is thought to be related to 1 the…
A: Note: Hi there thank you for posting the question. As there are multiple sub-parts, according to our…
Q: ovides both educational and entertaining lectures, exhibitions, and opportunities to observe nature.…
A: a. A linear regression model corresponds to a linear regression model that minimizes the sum of…
Q: + 10 12 13 14 data 11 15 16 17 18 Based on the boxplot above, what is the value for the median
A: The objective is to find the value of median based on the box plot.
Q: Skim Milk: 0.033 g/mL Class Data: 0.0295 g/mL 0.0228 g/mL 0.0213 g/mL 0.0219 g/mL 0.0269 g/mL…
A: Introduction: Accuracy: An observed value is said to show accuracy, if it matches exactly with the…
Q: CHAPTER 6-General Health and Population Indicators The next three questions relate to the following…
A: 1) Infant Mortality Rate 2) Maternal Mortality Rate 3) Crude Mortality Rate due to Cancer 4)…
Q: Twin Births Twin Births 1995-1997 (In Thousands) Term or Preterm with Preterm without procedures 14…
A: Given that - A medical publication published a study that examined pregnancies that resulted in the…
Q: 1. Almost all U.S. light-rail systems use electric cars that run on tracks built at street level.…
A: . Since you have posted a question with multiple sub-parts, we will solve first three subparts…
Q: Solve the problem. Suppose that demographic studies show that each year about 6% of a city's…
A:
Q: 1. Almost all U.S. light-rail systems use electric cars that run on tracks built at street level.…
A: Since you have posted a question with multiple sub-parts, we will solve first three subparts for…
Q: The Federal Bureau of Investigation reports state-level and national data on crimes. An…
A: The question is about comparison of incidence of crime Given : No. of crimes in year 1991 = 28000…
Q: 2- The range for the following data: 70,40,6,50,13,8,90,30 is equal to
A: The given data: 70, 40, 6, 50, 13, 8, 90, 30 Formula used: The range of the data is Range=Xm-Xo…
Q: Which statement best characterizes the definitions of categorical and quantitative data?…
A: A data is said to be quantitative data if it can be measured on numeric or quantitative scale.…
Q: 100% 89.6% 90% 84.1% Seat belt use rate 80% 70% 60% 50% 43.6% 38.5% 40% Percent of unrestrained…
A:
Q: Create properly formatted tables that compare the prevalence of obesity with respect to sex and…
A: Given Information: No. of variables=02Variables=1. Level of obesity with respect to sex2. Level of…
Q: 3. The electric power consumed each month by a chemical plant is thought to be related to 1 the…
A:
Q: Journal of Economic, Political and Business Analysis XIV (2) delivers a report on the stagnation of…
A: Average=sum of observationsnumber of observationsMedian=n+12th observation if n is oddn2+n2+1th…
Q: In the early 2000s interest rates were low so many homeowners refinanced their home mortgages. Linda…
A: Data : 59.2, 59.5, 61.6, 65.5, 66.6, 72.9, 74.8, 77.3, 79.2, 83.7, 85.6, 85.8, 86.6, 87.0, 87.1,…
Q: table below and assume a population of 314 million. How much greater is the risk of death from…
A: We have to check which disease is more risky.
Q: 1.) Answer the following questions (parts a-c) below about quantitative vs qualitative data a.…
A: Categorical variable: Categorical variable categories each individual to corresponding groups. It is…
Q: 100% 89.6% 90% 84.1% Seat belt use rate 80% 70% 60% 50% 43.6% 38.5% 40% Percent of unrestrained…
A: The given graph depicting the trend of seat belt use rate and percentage of unrestrained vehicle…
Q: South Asia Africa Totals America Malaria 31 14 45 90 Malaria B Malaria 53 60 53 45 100 Totals 86 64…
A: Given data: The provided contingency table is, Let the level of significance = 0.05. To test the…
Q: Each data point in this figure is a descriptive statistic. Identify that descriptive statistic and…
A: Descriptive statistics describes the characteristics of the data set it has two basic categories…
Q: The electric power consumed each month by a chemical plant is thought to be related to the average…
A: We need to find the multiple linear regression model given in the question.
Q: To test for the biodiversity of trees in a tropical rain forest, biologists collected data in the…
A: The curve to be fitted is of the form of y=axbTaking the logarithm on both sides…
Q: b) The table below shows the number of photocopies made by Kenyatta University students at three…
A: Solution : Given : Number of photocopies made by Kenyatta University students at three locations…
Q: Which of the following falls under qualitative data? The average height of members in a basketball…
A:
Q: The following data are derived from the Monthly Vital Statistics Report (October 1999) issued by the…
A: a. Total probability: Let A1,...,Ak be mutually exclusive and exhaustive events, then the…
Q: Table 3.3 gives the 2008 profits (rounded to billions of dollars) of 12 companies selected from all…
A:
Q: 2. Your company is designing a new Ferris wheel based on an older one at the Mathland Amusement…
A: Draw the graph of the function using the given points. Let the time be on the x-axis and their…
Q: 1. Almost all U.S. light-rail systems use electric cars that run on tracks built at street level.…
A: “Since you have posted a question with multiple sub-parts, we will solve first three subparts for…
Q: Here is a data set summarized as a stem-and-leaf plot: Stem Leaf 6 1 2 2 3 4 9 7 2 2 2 2 4 9 9 8 4…
A: The stem and Leaf plot is given.
Q: A man runs 1 mile approximately once per weekend. He records his time over an 18-week period. The…
A: 1) The mean 1 mile running time over 18 weeks is 2) The standard deviation of the 1 mile running…
Q: 10.- The percentages of osteopathic doctors who are women are given in the table for various years.…
A: It is given that 'p' is the percentage of osteopathic doctors who are women at t years since 1980.…
Q: 7. Give 5 types of information collected by surveillance system. TABLE 1 Original Enrolment Dead at…
A: There are 3141 nondiabetic men and 185 diabetic men. So the ratio is 3141: 185 Answer(A): 3141 :…
Q: 2. What types of graphs you can draw for a Qualitative (Categorical) variable? 3. What types of…
A: 2. The qualitative data is the descriptive and conceptual findings collected through questionnaires,…
Q: A hypothetical data regarding consumption of fast food observed among the adults of a country is…
A: 1) Sex ratio of male to female fast food consumers will be =Number of male who comsumes fast…
Q: 1. Almost all U.S. light-rail systems use electric cars that run on tracks built at street level.…
A: The scatter diagram for Miles of track Vs Ridership is as follow: From the scatterplot it is clear…
Q: 8 9 10 11 12 13 14 15 16 17 18 19 20 data Based on the boxplot above, identify the 5 number summary
A:
Q: E2ording to Statistics Canada population projections, visible minorities could account for over of…
A: Given that According to Statistics Canada population projections visible minorities could account…
Q: A discrete variable is A qualitative variable is
A:
Q: Discuss the following with examples a) Continues and discrete variable b) Quantitative and…
A: Note Since you have posted a question with multiple sub-parts, we will solve first three sub-parts…
Step by step
Solved in 2 steps with 2 images