Did the samples shown most likely come from the same population, or two different populations? If they are most likely from different populations, which population has the greater mean?
Did the samples shown most likely come from the same population, or two different populations? If they are most likely from different populations, which population has the greater mean?

Glencoe Algebra 1, Student Edition, 9780079039897, 0079039898, 2018
18th Edition
ISBN:9780079039897
Author:Carter
Publisher:Carter
Chapter10: Statistics
Section10.6: Summarizing Categorical Data
Problem 10CYU

Related questions
Question
100%
3. Did the samples shown most likely come from the same population, or two different populations? If they are most likely from different populations, which population
has the greater mean?
Transcribed Image Text:Parap
E TMP
F Anno
Emos.explorelearning.com/index.cfm?method%3DcResource.dspView&ResourcelD=508&Clas
ler
+ Bell Schedules - Ab..
G kkkk
I AP CAPSTONE
AP Environmental...
AP
O D. sample D
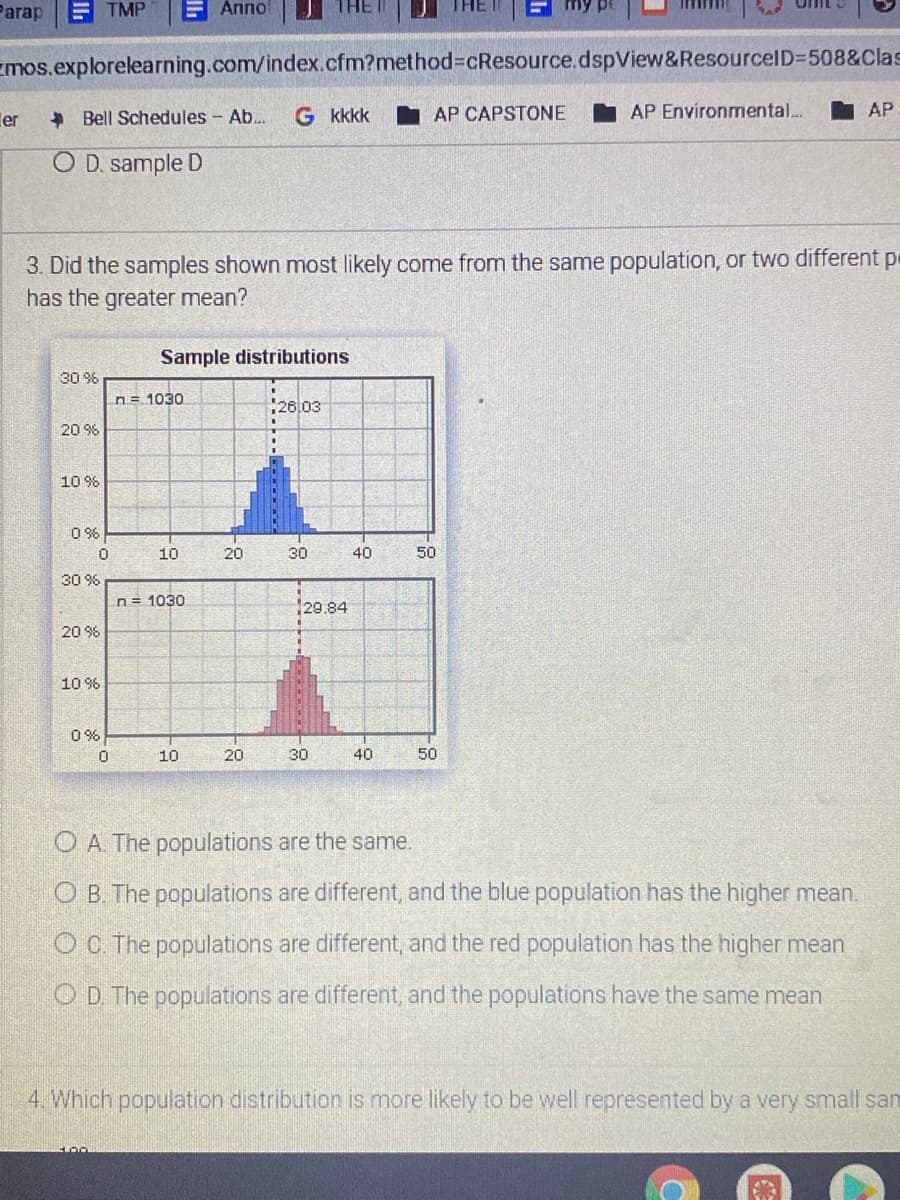
3. Did the samples shown most likely come from the same population, or two different pe
has the greater mean?
Sample distributions
30 96
n= 1030
26,03
20 %
10 9%
O 96
10
20
30
40
50
30 9%
n= 1030
129.84
20 9%
10 %
0 %
10
20
30
40
50
O A The populations are the same.
O B. The populations are different, and the blue population has the higher mean.
O C. The populations are different, and the red population has the higher mean
OD The populations are different, and the populations have the same mean
4 Which population distribution is more likely to be well represented by a very small san
Expert Solution
This question has been solved!
Explore an expertly crafted, step-by-step solution for a thorough understanding of key concepts.

This is a popular solution!

Trending now
This is a popular solution!

Step by step
Solved in 2 steps with 1 images

Recommended textbooks for you
Glencoe Algebra 1, Student Edition, 9780079039897…
Algebra
ISBN:
9780079039897
Author:
Carter
Publisher:
McGraw Hill

Holt Mcdougal Larson Pre-algebra: Student Edition…
Algebra
ISBN:
9780547587776
Author:
HOLT MCDOUGAL
Publisher:
HOLT MCDOUGAL
Glencoe Algebra 1, Student Edition, 9780079039897…
Algebra
ISBN:
9780079039897
Author:
Carter
Publisher:
McGraw Hill
Holt Mcdougal Larson Pre-algebra: Student Edition…
Algebra
ISBN:
9780547587776
Author:
HOLT MCDOUGAL
Publisher:
HOLT MCDOUGAL