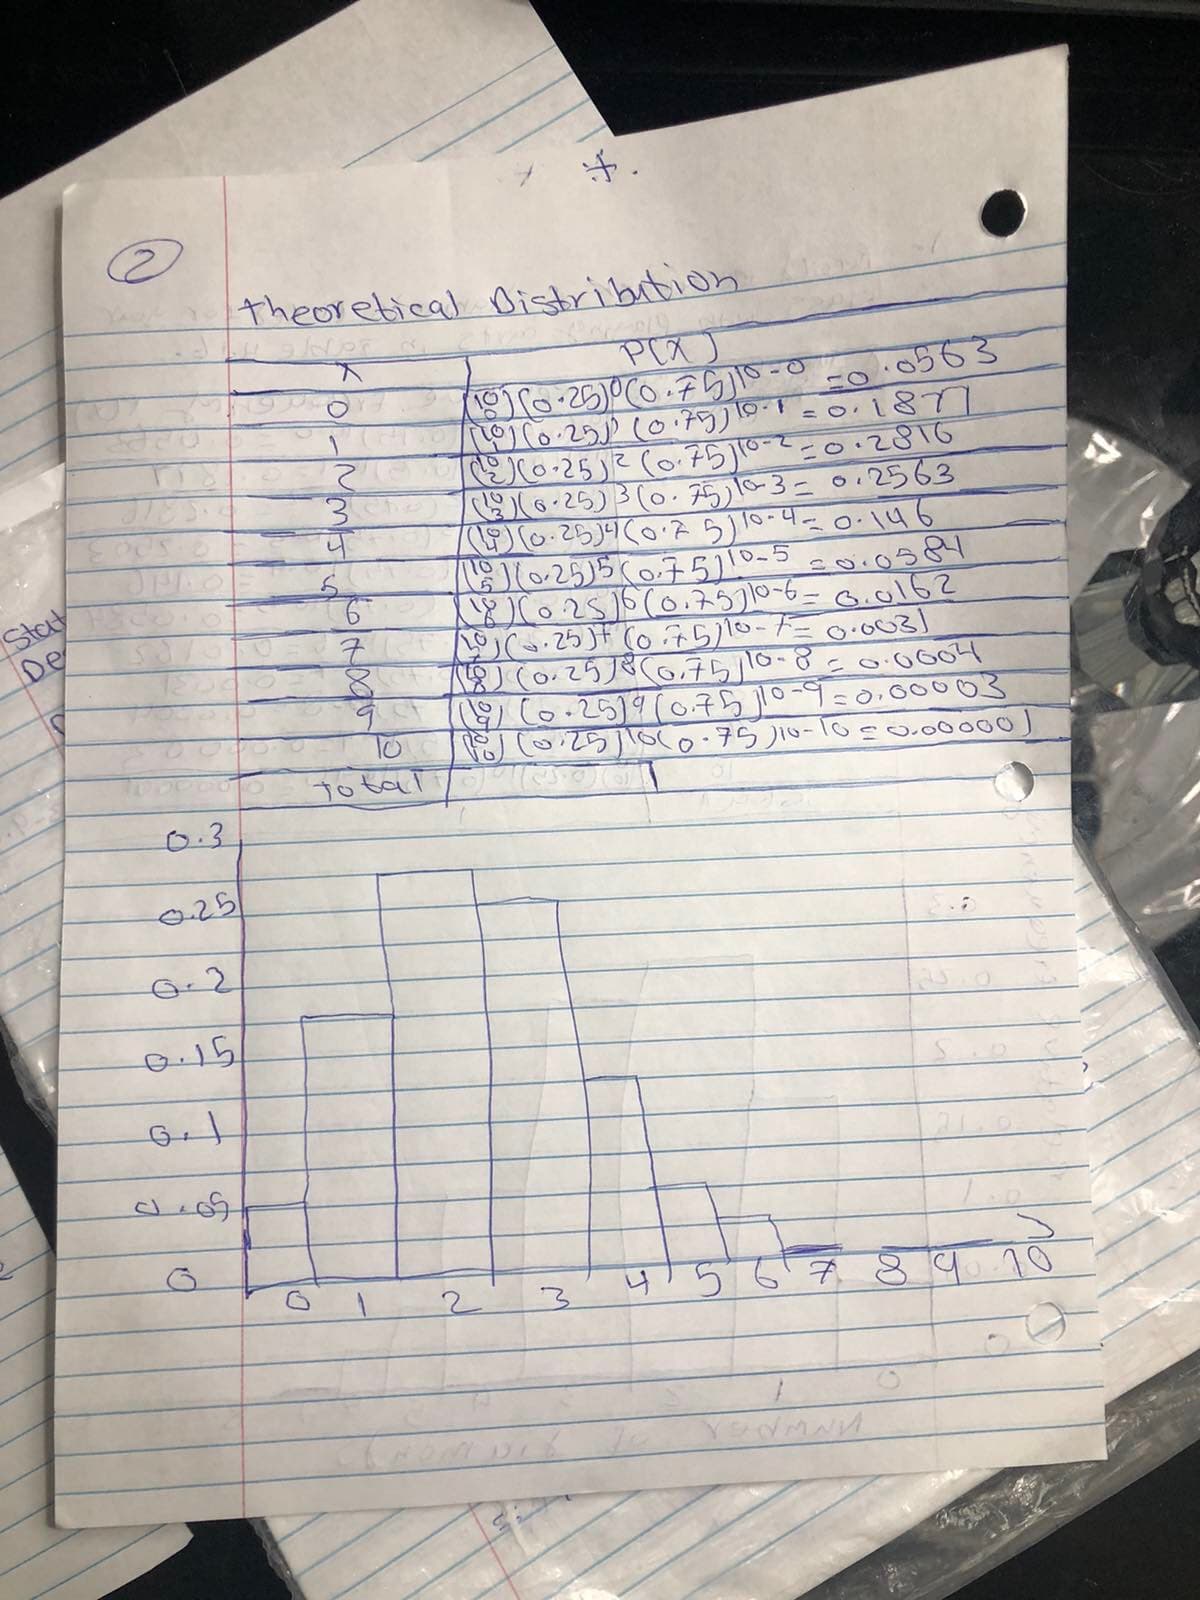
Discussion Questions For questions 1 and 2, think about the shapes of the two graphs, the probabilities, the relative frequencies, the means, and the standard deviations. 2. Describe the three most significant differences between the graphs or distributions of the theoretical, empirical, and simulation distributions. 3. Using your answers from questions 1 and 2, does it appear that the two sets of data fit the theoretical distribution? In complete sentences, explain why or why not. 4. Suppose that the experiment had been repeated 500 times. Would you expect Table 4.16 or Figure 4.6 to change, and how would it change? Why? Why wouldn’t the other table(s) change?
Discussion Questions For questions 1 and 2, think about the shapes of the two graphs, the probabilities, the relative frequencies, the means, and the standard deviations. 2. Describe the three most significant differences between the graphs or distributions of the theoretical, empirical, and simulation distributions. 3. Using your answers from questions 1 and 2, does it appear that the two sets of data fit the theoretical distribution? In complete sentences, explain why or why not. 4. Suppose that the experiment had been repeated 500 times. Would you expect Table 4.16 or Figure 4.6 to change, and how would it change? Why? Why wouldn’t the other table(s) change?

Glencoe Algebra 1, Student Edition, 9780079039897, 0079039898, 2018
18th Edition
ISBN:9780079039897
Author:Carter
Publisher:Carter
Chapter10: Statistics
Section10.4: Distributions Of Data
Problem 22PFA

Related questions

Question
Discussion Questions
For questions 1 and 2, think about the shapes of the two graphs, the probabilities, the relative frequencies, the means, and the standard deviations.
2. Describe the three most significant differences between the graphs or distributions of the theoretical, empirical, and simulation distributions.
3. Using your answers from questions 1 and 2, does it appear that the two sets of data fit the theoretical distribution? In complete sentences, explain why or why not.
4. Suppose that the experiment had been repeated 500 times. Would you expect Table 4.16 or Figure 4.6 to change, and how would it change? Why? Why wouldn’t the other table(s) change?

Expert Solution
This question has been solved!
Explore an expertly crafted, step-by-step solution for a thorough understanding of key concepts.

This is a popular solution!

Trending now
This is a popular solution!

Step by step
Solved in 2 steps with 2 images

Knowledge Booster


Learn more about
Need a deep-dive on the concept behind this application? Look no further. Learn more about this topic, statistics and related others by exploring similar questions and additional content below.Recommended textbooks for you
Glencoe Algebra 1, Student Edition, 9780079039897…
Algebra
ISBN:
9780079039897
Author:
Carter
Publisher:
McGraw Hill

Big Ideas Math A Bridge To Success Algebra 1: Stu…
Algebra
ISBN:
9781680331141
Author:
HOUGHTON MIFFLIN HARCOURT
Publisher:
Houghton Mifflin Harcourt

Algebra & Trigonometry with Analytic Geometry
Algebra
ISBN:
9781133382119
Author:
Swokowski
Publisher:
Cengage
Glencoe Algebra 1, Student Edition, 9780079039897…
Algebra
ISBN:
9780079039897
Author:
Carter
Publisher:
McGraw Hill
Big Ideas Math A Bridge To Success Algebra 1: Stu…
Algebra
ISBN:
9781680331141
Author:
HOUGHTON MIFFLIN HARCOURT
Publisher:
Houghton Mifflin Harcourt
Algebra & Trigonometry with Analytic Geometry
Algebra
ISBN:
9781133382119
Author:
Swokowski
Publisher:
Cengage