DM SR CHAPTER 12 ASSOCIATION BETWEEN VARIABLES MEASURE 124 PS The following variables were collected for a sample of ten precincts during the last national election. Compute r and r for each combination of variables and write a paragraph interpreting the rela- tionship between these variables. Take voter turnout as the dependent variable. or number of bin (death rate or number and LifeExp (life cxpe years of life a newbor Click Graphs, Le • On the "Scatter Scatter and then c On the "Simple Sc • Find BrthRate the variable nam • Find GNIcap am variable name tc Percentage Democrat Percentage Minority Percentage Voter Turnout Precinct 33 6. 15 09 64 C. 62 18 99 55 • Click OK and th 45 12 SPSS output wim • To add the regressic • Click anywhere Editor" window • Click the Elemes window and, in t Line at Total. A new windowH panel, click Line •Close the "Chat the Output wind ( Repeat the Graphs Dot commands a Scatterplot" wi BirthRate. Repe scatterpiot for • Repeat the G Dot comm for De Repeat 52 8. 85 25 25 42 13 68 88 33 5. 125 Soc The basketball coach at a small local col- Iege believes that his team plays better and scores thore points in front of larger crowds. The number of points scored and attendance for all home games last season are reported here. Do these data support the 6. Coach's argument? Game for Points Scored Attendance ich 54 pur these 3. There? uojssa 478 08
DM SR CHAPTER 12 ASSOCIATION BETWEEN VARIABLES MEASURE 124 PS The following variables were collected for a sample of ten precincts during the last national election. Compute r and r for each combination of variables and write a paragraph interpreting the rela- tionship between these variables. Take voter turnout as the dependent variable. or number of bin (death rate or number and LifeExp (life cxpe years of life a newbor Click Graphs, Le • On the "Scatter Scatter and then c On the "Simple Sc • Find BrthRate the variable nam • Find GNIcap am variable name tc Percentage Democrat Percentage Minority Percentage Voter Turnout Precinct 33 6. 15 09 64 C. 62 18 99 55 • Click OK and th 45 12 SPSS output wim • To add the regressic • Click anywhere Editor" window • Click the Elemes window and, in t Line at Total. A new windowH panel, click Line •Close the "Chat the Output wind ( Repeat the Graphs Dot commands a Scatterplot" wi BirthRate. Repe scatterpiot for • Repeat the G Dot comm for De Repeat 52 8. 85 25 25 42 13 68 88 33 5. 125 Soc The basketball coach at a small local col- Iege believes that his team plays better and scores thore points in front of larger crowds. The number of points scored and attendance for all home games last season are reported here. Do these data support the 6. Coach's argument? Game for Points Scored Attendance ich 54 pur these 3. There? uojssa 478 08

College Algebra (MindTap Course List)
12th Edition
ISBN:9781305652231
Author:R. David Gustafson, Jeff Hughes
Publisher:R. David Gustafson, Jeff Hughes
Chapter4: Polynomial And Rational Functions
Section4.6: Rational Functions
Problem 87E

Related questions
Question
100%
How to work this problem 12.4
Transcribed Image Text:DM SR
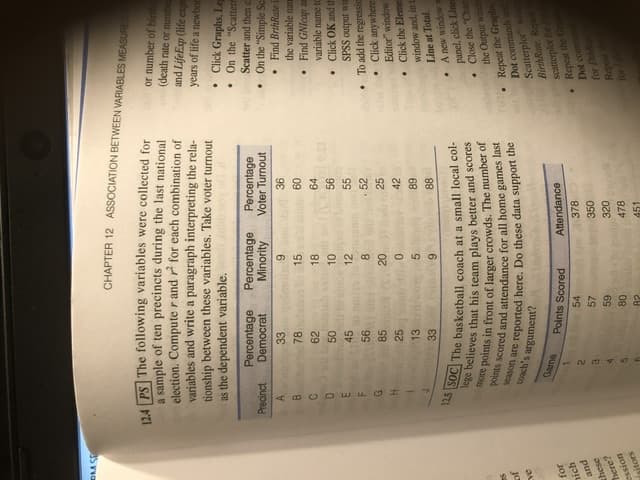
CHAPTER 12 ASSOCIATION BETWEEN VARIABLES MEASURE
124 PS The following variables were collected for
a sample of ten precincts during the last national
election. Compute r and r for each combination of
variables and write a paragraph interpreting the rela-
tionship between these variables. Take voter turnout
as the dependent variable.
or number of bin
(death rate or number
and LifeExp (life cxpe
years of life a newbor
Click Graphs, Le
• On the "Scatter
Scatter and then c
On the "Simple Sc
• Find BrthRate
the variable nam
• Find GNIcap am
variable name tc
Percentage
Democrat
Percentage
Minority
Percentage
Voter Turnout
Precinct
33
6.
15
09
64
C.
62
18
99
55
• Click OK and th
45
12
SPSS output wim
• To add the regressic
• Click anywhere
Editor" window
• Click the Elemes
window and, in t
Line at Total.
A new windowH
panel, click Line
•Close the "Chat
the Output wind
( Repeat the Graphs
Dot commands a
Scatterplot" wi
BirthRate. Repe
scatterpiot for
• Repeat the G
Dot comm
for De
Repeat
52
8.
85
25
25
42
13
68
88
33
5.
125 Soc The basketball coach at a small local col-
Iege believes that his team plays better and scores
thore points in front of larger crowds. The number of
points scored and attendance for all home games last
season are reported here. Do these data support the
6.
Coach's argument?
Game
for
Points Scored
Attendance
ich
54
pur
these
3.
There?
uojssa
478
08
Expert Solution
This question has been solved!
Explore an expertly crafted, step-by-step solution for a thorough understanding of key concepts.

This is a popular solution!

Trending now
This is a popular solution!

Step by step
Solved in 2 steps with 2 images

Knowledge Booster


Learn more about
Need a deep-dive on the concept behind this application? Look no further. Learn more about this topic, statistics and related others by exploring similar questions and additional content below.Recommended textbooks for you
College Algebra (MindTap Course List)
Algebra
ISBN:
9781305652231
Author:
R. David Gustafson, Jeff Hughes
Publisher:
Cengage Learning

Algebra & Trigonometry with Analytic Geometry
Algebra
ISBN:
9781133382119
Author:
Swokowski
Publisher:
Cengage

Glencoe Algebra 1, Student Edition, 9780079039897…
Algebra
ISBN:
9780079039897
Author:
Carter
Publisher:
McGraw Hill
College Algebra (MindTap Course List)
Algebra
ISBN:
9781305652231
Author:
R. David Gustafson, Jeff Hughes
Publisher:
Cengage Learning
Algebra & Trigonometry with Analytic Geometry
Algebra
ISBN:
9781133382119
Author:
Swokowski
Publisher:
Cengage
Glencoe Algebra 1, Student Edition, 9780079039897…
Algebra
ISBN:
9780079039897
Author:
Carter
Publisher:
McGraw Hill

Big Ideas Math A Bridge To Success Algebra 1: Stu…
Algebra
ISBN:
9781680331141
Author:
HOUGHTON MIFFLIN HARCOURT
Publisher:
Houghton Mifflin Harcourt

Trigonometry (MindTap Course List)
Trigonometry
ISBN:
9781337278461
Author:
Ron Larson
Publisher:
Cengage Learning
