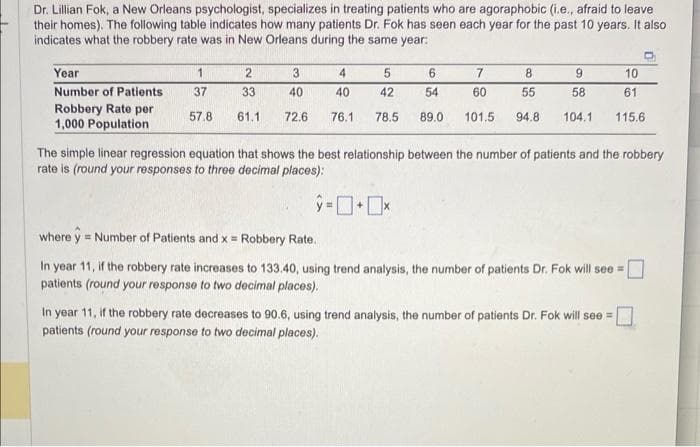
Dr. Lillian Fok, a New Orleans psychologist, specializes in treating patients who are agoraphobic (i.e., afraid to leave their homes). The following table indicates how many patients Dr. Fok has seen each year for the past 10 years. It also indicates what the robbery rate was in New Orleans during the same year: Year Number of Patients Robbery Rate per 1,000 Population 1 2 3 4 37 33 40 40 57.8 61.1 72.6 76.1 5 42 78.5 6 8 9 10 54 55 58 61 89.0 101.5 94.8 104.1 115.6 ŷ=+x 7 60 The simple linear regression equation that shows the best relationship between the number of patients and the robbery rate is (round your responses to three decimal places): where y Number of Patients and x = Robbery Rate. In year 11, if the robbery rate increases to 133.40, using trend analysis, the number of patients Dr. Fok will see = patients (round your response to two decimal places). In year 11, if the robbery rate decreases to 90.6, using trend analysis, the number of patients Dr. Fok will see = patients (round your response to two decimal places).


Q: Q- Which type of work process transformation is suitable to apply for addressing initiatives driven…
A: A systematic technique for detecting and fixing issues in a work process is known as process…
Q: Engineering Management 1. Assuming you are the project engineer of a certain construction project,…
A: Quality management in Construction projects comprises of putting the policies & procedures to…
Q: Construct the decision tree diagram. Answer NA and upload the decision tree in this bin. Blank 1 b)…
A: NOTE: We are allowed to do the first three sub-parts only. Decision trees are best used when there…
Q: mental models have on the decision-making process
A: You can grasp life by using mental models. One mental model that can help you comprehend how the…
Q: Using a 2 month weighted moving average with weights of 75% for the previous month and 25% for two…
A: Given Weight 1 = 75% = 0.75 Weight 2 = 25% = 0.25
Q: a. Formulate an LP model for this problem. b. Implement your model in a spreadsheet and solve it.…
A: As per Bartleby guidelines, we can only solve the first three subparts of one question at a…
Q: Differentiate between the benefits and drawbacks of project scheduling. Please include any needed…
A: Project scheduling is a process of planning, organizing, and controlling the work necessary to…
Q: When several processes are taking place at once, how does the capacity analysis respond?
A: Capacity Analysis When capacity is always an issue, finding the source of the problem is priority…
Q: Hi-V produces three types of canned juice drinks, A, B, and C, using fresh strawberries, grapes, and…
A: Objective Functions and Constraints: Based on the given details, the objective…
Q: List two strategies for reducing the cost of rework. What part, in your view, does progressive…
A: Rework can be broadly defined as the process of correcting the defectives while inspecting or after…
Q: A local supermarket wants to determine how many cashier stations should be open to accommodate…
A: Observation Cashier Idle 1 3 2 0 3 1 4 4 5 2 6 0 7 2 8 2 9 0 10 3 11 3 12 1…
Q: What is pilot testing and why is it necessary?
A: Before conducting your primary study, you may evaluate your research strategy with a small sample…
Q: (5000 S) Assume that the initial forecast for February is 30.0 (in $ thousands) and the initial…
A: Ft = alpha*actual of previous period +(1-alpha)*previous forecast trend = beta*(Ft of same - Ft of…
Q: Demonstrate how executive leadership is an important part of strategic management.
A: Strategic management can be stated as the formulation and execution of major goals and projects, by…
Q: A political candidate is planning his media budget for an upcoming election. He has $90,500 to…
A: Let, S = Number of small road signs to be placed L = Number of large road signs to be placed B =…
Q: Do you think this is true? Supply chain management systems are outside oriented, while enterprise…
A: Analysts in the field of supply chain management generally agree that in order for businesses to…
Q: If the mean = 20.3834 standard deviation = 101.53 What is the probability that daily demand will…
A: Given data: Mean (μ) = 20.3834 Standard deviation (σ) = 101.53
Q: Gamers Company develops gaming software. Software programmers are paid $32 per hour for…
A: Software programmera paid rate(S) = $32 Overtime(O) = $16 Overtime hour(H) = 7 Productive hour(P) =…
Q: One of the chair lifts at a ski resort unloads 1,900 skiers per hour at the top of the slope. The…
A: Operation management is performed in each manufacturing organization. It all deals with the…
Q: A negative value for slack indicates: the problem is feasible O the problem is infeasible there may…
A: Linear programming is a mathematical model for finding the maximum or minimum of a linear function…
Q: Assuming the same assignment of tasks per stations shown in the previous question, calculate the…
A: Here, I have been given the table data, this table data includes Task Id, time in minutes for each…
Q: Find the assignment which minimizes total cost of the project. Each contractor has to be assigned…
A: An assignment problem is a technique to find the combinations of the optimal solution to the…
Q: A producer distributor uses 800 packing crates a month, which it purchases at a cost of $10 each.…
A: Monthly usage = d = 800 crates Purchase Cost = C = $10 Annual carrying cost = i = 35% Ordering cost…
Q: Consider the problem of assigning multiple identical machines to an individual operator for the…
A: Ideal assignment n = a+ta+b Here, a = Concurrent activity time (Basically loading and unloading…
Q: Bank with 2 tellers. Customers arrive at a rate 80 per hour and wait in a single line. Average time…
A: Number of tellers in the bank = 2 (i.e. 2 servers) Average service time per customer = 1.2 minutes…
Q: The following information is given to you D = 19,000 units/yr; H = $4/unit/year; S=$25/order.…
A: D = Annual Demand = 19000 units Inventory carrying cost = H = $4 Ordering Cost per order = $25 We…
Q: Describe the various phases of project with its relative importance?
A: Project management is challenging regardless of the size or scope. There is a lot that may go wrong,…
Q: What specific constraint was missed that gave us this 'half-house' result? Variables Constraints…
A: Linear programming problem This is a technique of solving different linear problems with given…
Q: Photon Technologies, Inc., a manufacturer of batteries for mobile phones, signed a contract with a…
A: (a) Let P1 - Units of PT-100 made in Phillippines P2 - Units of PT-200 made in Phillippines…
Q: 4. A manufacturing firm maintains one product assembly line to produce generators. The demand for…
A: Given, Demand = 85 units per week Production run = 8 hours per day and operates 5.5 days per week…
Q: (a) Formulate and solve a linear programming model for this make-or-buy application. (Let FM =…
A: As per Bartleby guidelines, we can only solve the first three subparts of one question at a…
Q: 2. Solve the LP using isocost method. Min Z = 2x + y s.t. x + y ≥5 2x + 6y ≥ 18 3x - y ≥ 3 x-2y ≤4…
A: Linear Programming Problems (LPP): To find the optimal answer to a mathematical model, linear…
Q: Determine if the linear programming problem below is a standard maximization problem. Objective:…
A: Given LP- Maximize Z = 47x + 39y Subject to-Constraint 1: -4x + 5y ≤ 300Constraint 2: 16x + 15y ≤…
Q: Determine whether project management software may aid in the successful management of project costs.
A: Workflow management and multiple project management have always been difficult tasks for project…
Q: Is decision tree based on a linear combination of parameters ?
A: Many popular machine learning algorithms are based on decision trees. In both classification and…
Q: push and pull boundary
A: There are two Types of Companies Supply Chain: 1. Push to Sell Supply Chain 2. Pull to Sell Supply…
Q: Q): Calculate EOQ where as Annual demand is 2543570 units Ordering cost per order is 78, Inventory…
A: Annual Demand = D = 2543570 units Ordering Cost per order = S = 78 Inventory carrying cost per unit…
Q: AT1 truck and a C1 car yield profits of $325 and $220, respectively, per vehicle sold. The aim of…
A:
Q: 7. Based on a recent forecast shared by a customer, the demand for product A is likely to increase…
A: In an organization different functions are interrelated, so if one function is impacted, the effect…
Q: Understanding the distinctions between project management and software project management is…
A: Project Management: Project management is the process of application of collection of tools and…
Q: The following is a table of activities associated with a project at Rafay Ishfaq's software firm in…
A: Project crashing is a process which helps to reduce the total duration using additional costs.…
Q: Review the essential elements of an ERP system for a manufacturing business.
A: Enterprise resource planning can be defined as a business suite that integrates the functionalities…
Q: Calculate ROI if profit margin is 12% and Asset turn over ratio is 1.4? Q): calculate ReOrder Point…
A: Given: Profit margin= 12% Asset turnover ratio = 1.4
Q: The ABC Company is making a production plan for the next year, given the sales forecast for the next…
A: Given- Total employees = 12Inventory carrying cost = $2 per unitHiring costs = $1,600 per…
Q: Determine the best investment, using the following decision criteria: a) Maximin b) Equal…
A: NOTE: We are allowed to do the first three sub-parts only. Maximin: Maximin is a decision-making…
Q: a. Assuming unlimited demand, what is the flow rate of the process in customers per hour? (Round to…
A: As per Bartleby guidelines, we can only solve the first three subparts of one question at a…
Q: The Astana airline always books more passengers on a flight than its capacity because of last…
A: Find the Given details below: Given details: Airline charge $ 835 Coupon charge…
Q: Your Lego furniture company makes Tables and Chairs. Below, you are given the starting inventory,…
A:
Q: How do you use the Silver-Meal ordering policy to find the Total annual Cost for the damand and…
A: Instructions Determine the average cost for each demand on an individual basis and on a combined…
Q: The owner of Darkest Tans Unlimited in a local mall is forecasting this month's (October's) demand…
A: The following formula for exponential smoothing forecast (Alpha*Actual demand)+(1-alpha)*Forecast…

Step by step
Solved in 4 steps with 1 images

- The eTech Company is a fairly recent entry in the electronic device area. The company competes with Apple. Samsung, and other well-known companies in the manufacturing and sales of personal handheld devices. Although eTech recognizes that it is a niche player and will likely remain so in the foreseeable future, it is trying to increase its current small market share in this huge competitive market. Jim Simons, VP of Production, and Catherine Dolans, VP of Marketing, have been discussing the possible addition of a new product to the companys current (rather limited) product line. The tentative name for this new product is ePlayerX. Jim and Catherine agree that the ePlayerX, which will feature a sleeker design and more memory, is necessary to compete successfully with the big boys, but they are also worried that the ePlayerX could cannibalize sales of their existing productsand that it could even detract from their bottom line. They must eventually decide how much to spend to develop and manufacture the ePlayerX and how aggressively to market it. Depending on these decisions, they must forecast demand for the ePlayerX, as well as sales for their existing products. They also realize that Apple. Samsung, and the other big players are not standing still. These competitors could introduce their own new products, which could have very negative effects on demand for the ePlayerX. The expected timeline for the ePlayerX is that development will take no more than a year to complete and that the product will be introduced in the market a year from now. Jim and Catherine are aware that there are lots of decisions to make and lots of uncertainties involved, but they need to start somewhere. To this end. Jim and Catherine have decided to base their decisions on a planning horizon of four years, including the development year. They realize that the personal handheld device market is very fluid, with updates to existing products occurring almost continuously. However, they believe they can include such considerations into their cost, revenue, and demand estimates, and that a four-year planning horizon makes sense. In addition, they have identified the following problem parameters. (In this first pass, all distinctions are binary: low-end or high-end, small-effect or large-effect, and so on.) In the absence of cannibalization, the sales of existing eTech products are expected to produce year I net revenues of 10 million, and the forecast of the annual increase in net revenues is 2%. The ePIayerX will be developed as either a low-end or a high-end product, with corresponding fixed development costs (1.5 million or 2.5 million), variable manufacturing costs ( 100 or 200). and selling prices (150 or 300). The fixed development cost is incurred now, at the beginning of year I, and the variable cost and selling price are assumed to remain constant throughout the planning horizon. The new product will be marketed either mildly aggressively or very aggressively, with corresponding costs. The costs of a mildly aggressive marketing campaign are 1.5 million in year 1 and 0.5 million annually in years 2 to 4. For a very aggressive campaign, these costs increase to 3.5 million and 1.5 million, respectively. (These marketing costs are not part of the variable cost mentioned in the previous bullet; they are separate.) Depending on whether the ePlayerX is a low-end or high-end produce the level of the ePlayerXs cannibalization rate of existing eTech products will be either low (10%) or high (20%). Each cannibalization rate affects only sales of existing products in years 2 to 4, not year I sales. For example, if the cannibalization rate is 10%, then sales of existing products in each of years 2 to 4 will be 10% below their projected values without cannibalization. A base case forecast of demand for the ePlayerX is that in its first year on the market, year 2, demand will be for 100,000 units, and then demand will increase by 5% annually in years 3 and 4. This base forecast is based on a low-end version of the ePlayerX and mildly aggressive marketing. It will be adjusted for a high-end will product, aggressive marketing, and competitor behavior. The adjustments with no competing product appear in Table 2.3. The adjustments with a competing product appear in Table 2.4. Each adjustment is to demand for the ePlayerX in each of years 2 to 4. For example, if the adjustment is 10%, then demand in each of years 2 to 4 will be 10% lower than it would have been in the base case. Demand and units sold are the samethat is, eTech will produce exactly what its customers demand so that no inventory or backorders will occur. Table 2.3 Demand Adjustments When No Competing Product Is Introduced Table 2.4 Demand Adjustments When a Competing Product Is Introduced Because Jim and Catherine are approaching the day when they will be sharing their plans with other company executives, they have asked you to prepare an Excel spreadsheet model that will answer the many what-if questions they expect to be asked. Specifically, they have asked you to do the following: You should enter all of the given data in an inputs section with clear labeling and appropriate number formatting. If you believe that any explanations are required, you can enter them in text boxes or cell comments. In this section and in the rest of the model, all monetary values (other than the variable cost and the selling price) should be expressed in millions of dollars, and all demands for the ePlayerX should be expressed in thousands of units. You should have a scenario section that contains a 0/1 variable for each of the binary options discussed here. For example, one of these should be 0 if the low-end product is chosen and it should be 1 if the high-end product is chosen. You should have a parameters section that contains the values of the various parameters listed in the case, depending on the values of the 0/1 variables in the previous bullet For example, the fixed development cost will be 1.5 million or 2.5 million depending on whether the 0/1 variable in the previous bullet is 0 or 1, and this can be calculated with a simple IF formula. You can decide how to implement the IF logic for the various parameters. You should have a cash flows section that calculates the annual cash flows for the four-year period. These cash flows include the net revenues from existing products, the marketing costs for ePlayerX, and the net revenues for sales of ePlayerX (To calculate these latter values, it will help to have a row for annual units sold of ePlayerX.) The cash flows should also include depreciation on the fixed development cost, calculated on a straight-line four-year basis (that is. 25% of the cost in each of the four years). Then, these annual revenues/costs should be summed for each year to get net cash flow before taxes, taxes should be calculated using a 32% tax rate, and taxes should be subtracted and depreciation should be added back in to get net cash flows after taxes. (The point is that depreciation is first subtracted, because it is not taxed, but then it is added back in after taxes have been calculated.) You should calculate the company's NPV for the four-year horizon using a discount rate of 10%. You can assume that the fixed development cost is incurred now. so that it is not discounted, and that all other costs and revenues are incurred at the ends of the respective years. You should accompany all of this with a line chart with three series: annual net revenues from existing products; annual marketing costs for ePlayerX; and annual net revenues from sales of ePlayerX. Once all of this is completed. Jim and Catherine will have a powerful tool for presentation purposes. By adjusting the 0/1 scenario variables, their audience will be able to see immediately, both numerically and graphically, the financial consequences of various scenarios.If a monopolist produces q units, she can charge 400 4q dollars per unit. The variable cost is 60 per unit. a. How can the monopolist maximize her profit? b. If the monopolist must pay a sales tax of 5% of the selling price per unit, will she increase or decrease production (relative to the situation with no sales tax)? c. Continuing part b, use SolverTable to see how a change in the sales tax affects the optimal solution. Let the sales tax vary from 0% to 8% in increments of 0.5%.This problem is based on Motorolas online method for choosing suppliers. Suppose Motorola solicits bids from five suppliers for eight products. The list price for each product and the quantity of each product that Motorola needs to purchase during the next year are listed in the file P06_93.xlsx. Each supplier has submitted the percentage discount it will offer on each product. These percentages are also listed in the file. For example, supplier 1 offers a 7% discount on product 1 and a 30% discount on product 2. The following considerations also apply: There is an administrative cost of 5000 associated with setting up a suppliers account. For example, if Motorola uses three suppliers, it incurs an administrative cost of 15,000. To ensure reliability, no supplier can supply more than 80% of Motorolas demand for any product. A supplier must supply an integer amount of each product it supplies. Develop a linear integer model to help Motorola minimize the sum of its purchase and administrative costs.
- Suppose that GLC earns a 2000 profit each time a person buys a car. We want to determine how the expected profit earned from a customer depends on the quality of GLCs cars. We assume a typical customer will purchase 10 cars during her lifetime. She will purchase a car now (year 1) and then purchase a car every five yearsduring year 6, year 11, and so on. For simplicity, we assume that Hundo is GLCs only competitor. We also assume that if the consumer is satisfied with the car she purchases, she will buy her next car from the same company, but if she is not satisfied, she will buy her next car from the other company. Hundo produces cars that satisfy 80% of its customers. Currently, GLC produces cars that also satisfy 80% of its customers. Consider a customer whose first car is a GLC car. If profits are discounted at 10% annually, use simulation to estimate the value of this customer to GLC. Also estimate the value of a customer to GLC if it can raise its customer satisfaction rating to 85%, to 90%, or to 95%. You can interpret the satisfaction value as the probability that a customer will not switch companies.Another way to derive a demand function is to break the market into segments and identify a low price, a medium price, and a high price. For each of these prices and market segments, we ask company experts to estimate product demand. Then we use Excels trend curve fitting capabilities to fit a quadratic function that represents that segments demand function. Finally, we add the segment demand curves to derive an aggregate demand curve. Try this procedure for pricing a candy bar. Assume the candy bar costs 0.55 to produce. The company plans to charge between 1.10 and 1.50 for this candy bar. Its marketing department estimates the demands shown in the file P07_47.xlsx (in thousands) in the three regions of the country where the candy bar will be sold. What is the profit-maximizing price, assuming that the same price will be charged in all three regions?The new Chief Operating Officer (COO) of Lee Ching Chemical Company, MaxChing, has found that the firm has been dumping its toxic waste into the local riverfor the last four years and falsifying information to officials about the amounts ofalleged cancer-causing materials in the waste. The plant overseer claims there is noevidence that the waste will cause cancer. Besides, within a hundred kilometersdownriver, there are only a few fishing villages. If the company had to treat thesubstance to neutralize its potentially harmful effects and transport it to a legaldumpsite, the operating costs of the company would rise to a level that could renderthe company uncompetitive. When the organization loses its competitive advantage,five thousand local workers can become unemployed and the economy of that towncould collapse. Question: If you were the COO, what would you do? Why?
- A motion picture industry analyst is studying movies based on epic novels. The following data were obtained for 10 Hollywood movies made in the past five years. Each movie was based on an epic novel. For these data, x1 = first-year box office receipts of the movie, x2 = total production costs of the movie, x3 = total promotional costs of the movie, and x4 = total book sales prior to movie release. All units are in millions of dollars. x1 x2 x3 x4 85.1 8.5 5.1 4.7 106.3 12.9 5.8 8.8 50.2 5.2 2.1 15.1 130.6 10.7 8.4 12.2 54.8 3.1 2.9 10.6 30.3 3.5 1.2 3.5 79.4 9.2 3.7 9.7 91.0 9.0 7.6 5.9 135.4 15.1 7.7 20.8 89.3 10.2 4.5 7.9 a) Suppose Hollywood is planning a new epic movie with projected box office sales x1 = 100 million and production costs x2 = 12 million. The book on which the movie is based had sales of x4 = 9.2 million. Forecast the dollar amount (in millions) that should be budgeted for promotion costs x3 and find an 80% confidence interval for your…The Tennessee Jack Distillery produces custom-blendedwhiskey. A particular blend consists of rye and bourbonwhiskey. The company has received an order for a minimumof 400 gallons of the custom blend. The customer specifiedthat the order must contain at least 40 percent rye and notmore than 250 gallons of bourbon. The customer also speci-fied that the blend should be mixed in the ratio of two partsrye to one part bourbon. The distillery can produce 500 gal-lons per week, regardless of the blend. The production man-ager wants to complete the order in one week. The blend issold for $12 per gallon. The distillery company’s cost pergallon is $4 for rye and $2 for bourbon. The company wantsto determine the blend mix that will meet customer require-ments and maximize profits.a. Formulate and solve a linear programming model forthis problem.b. Solve the problem using the graphical method.The Sea Wharf Restaurant would like to determine the best way to allocate a monthly advertising budget of $1000 between newspaper advertising and radio advertising. Management decided that at least 25% of the budget must be spent on each type of media, and that the amount of money spent on local newspaper advertising must be at least twice the amount spent on radio advertising. A marketing consultant developed an index that measures audience exposure per dollar of advertising on a scale from 0 to 100, with higher values implying greater audience exposure. If the value of the index for local newspaper advertising is 50 and the value of the index for spot radio advertising is 80, how should the restaurant allocate its advertising budget in order to maximize the value of total audience exposure? a. Formulate a linear programming model that can be used to determine how the restaurant should allocate its advertising budget in order to maximize the value of total audience exposure. It's…