Draw an ER diagram to show the relationships among the tables

Chapter1: Overview Of Database Concepts
Section: Chapter Questions
Problem 3MC

Related questions

Question
Draw an ER diagram to show the relationships among the tables
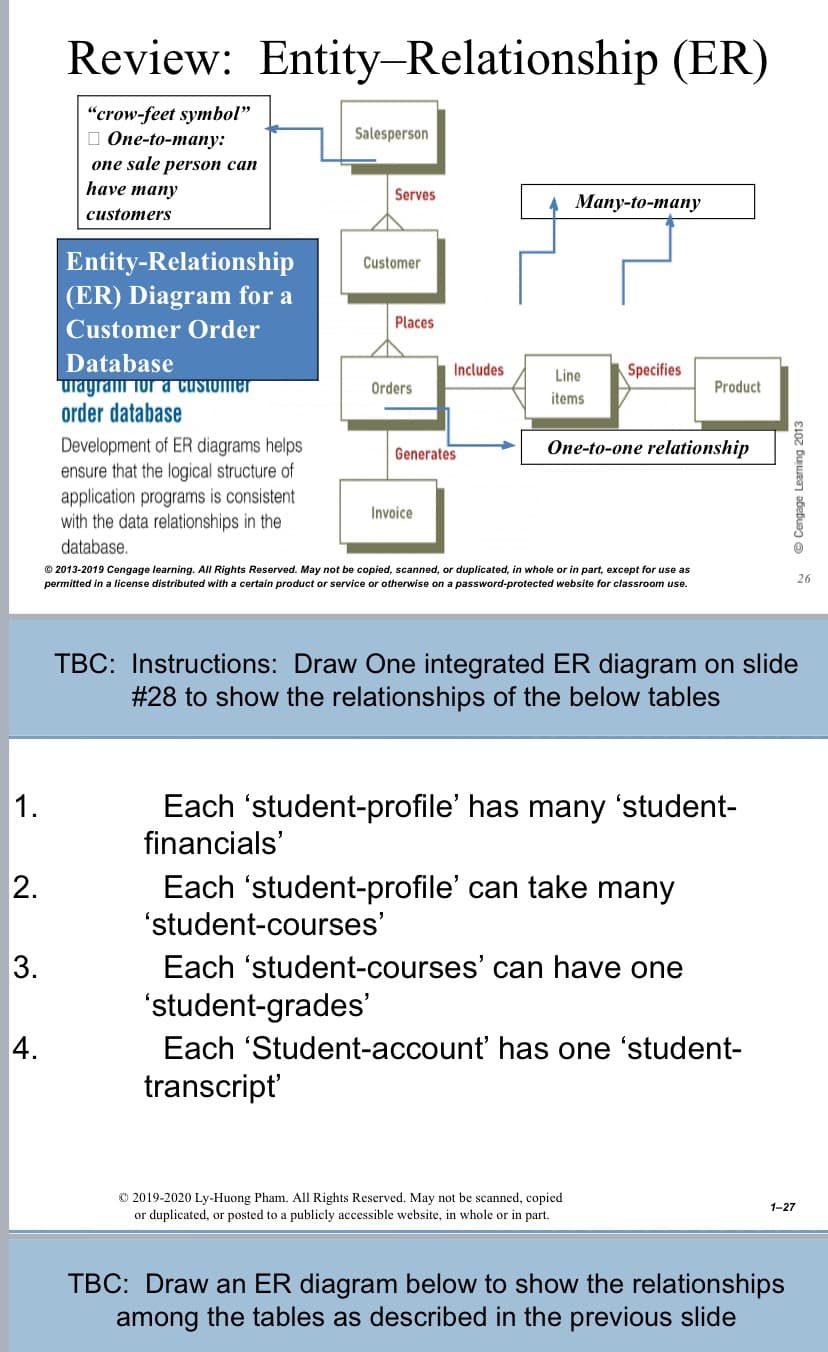
Transcribed Image Text:Review: Entity-Relationship (ER)
"crow-feet symbol"
О Опе-to-manпy:
one sale person can
Salesperson
have many
Serves
Мапy-to-many
customers
Entity-Relationship
(ER) Diagram for a
Customer
Places
Customer Order
Database
urayram Tor a customer
order database
Includes
Line
Specifies
Orders
Product
items
Development of ER diagrams helps
ensure that the logical structure of
application programs is consistent
with the data relationships in the
Generates
One-to-one relationship
Invoice
database.
© 2013-2019 Cengage learning. All Rights Reserved. May not be copied, scanned, or duplicated, in whole or in part, except for use as
permitted in a license distributed with a certain product or service or otherwise on a password-protected website for classroom use.
TBC: Instructions: Draw One integrated ER diagram on slide
# 28 to show the relationships of the below tables
Each 'student-profile' has many 'student-
financials'
1.
2.
Each 'student-profile' can take many
'student-courses'
3.
Each 'student-courses' can have one
'student-grades'
4.
Each 'Student-account' has one 'student-
transcript
© 2019-2020 Ly-Huong Pham. All Rights Reserved. May not be scanned, copied
1-27
or duplicated, or posted to a publicly accessible website, in whole or in part.
TBC: Draw an ER diagram below to show the relationships
among the tables as described in the previous slide
* e Cengage Learning 2013
Expert Solution
This question has been solved!
Explore an expertly crafted, step-by-step solution for a thorough understanding of key concepts.

This is a popular solution!

Trending now
This is a popular solution!

Step by step
Solved in 2 steps with 1 images

Knowledge Booster


Learn more about
Need a deep-dive on the concept behind this application? Look no further. Learn more about this topic, computer-science and related others by exploring similar questions and additional content below.Recommended textbooks for you