E MINDTAP Q Search this c Assignment eBook The admissions officer for Clearwater College developed the following estimated regression equation relating the final college GPA to the student's SAT mathematics score and high-school GPA. ŷ = -1.4053 +.02351 +.0049r2 where I1 = high-school grade point average T = SAT mathematics score y = final college grade point average Round your answers to 4 decimal places. a. Complete the missing entries in this Excel Regression tool output. Enter negative values as negative numbers. ANOVA df Significance F MS Windows 1.7621 Regression 52.29 0.9681 0.88105 5, y = final college grade point average Round your answers to 4 decimal places. a. Complete the missing entries in this Excel Regression tool output. Enter negative values as negative numbers. ANOVA df Significance F SS MS Regression 1.7621 52.29 2. 0.88105 0.9681 Residual 0.01685 0.11794 1.88 9. Total P-value t Stat Standard Error Coefficients 0.24 0.4848 -2.90 -1.4053 Intercept 0.0302 0.0087 2.71 0.0235 X1 0.003 0.0011 4.51 0.0049 X2 .05, test for overall significance. b. Using a= 12:03 1/26/2


Correlation
Correlation defines a relationship between two independent variables. It tells the degree to which variables move in relation to each other. When two sets of data are related to each other, there is a correlation between them.
Linear Correlation
A correlation is used to determine the relationships between numerical and categorical variables. In other words, it is an indicator of how things are connected to one another. The correlation analysis is the study of how variables are related.
Regression Analysis
Regression analysis is a statistical method in which it estimates the relationship between a dependent variable and one or more independent variable. In simple terms dependent variable is called as outcome variable and independent variable is called as predictors. Regression analysis is one of the methods to find the trends in data. The independent variable used in Regression analysis is named Predictor variable. It offers data of an associated dependent variable regarding a particular outcome.
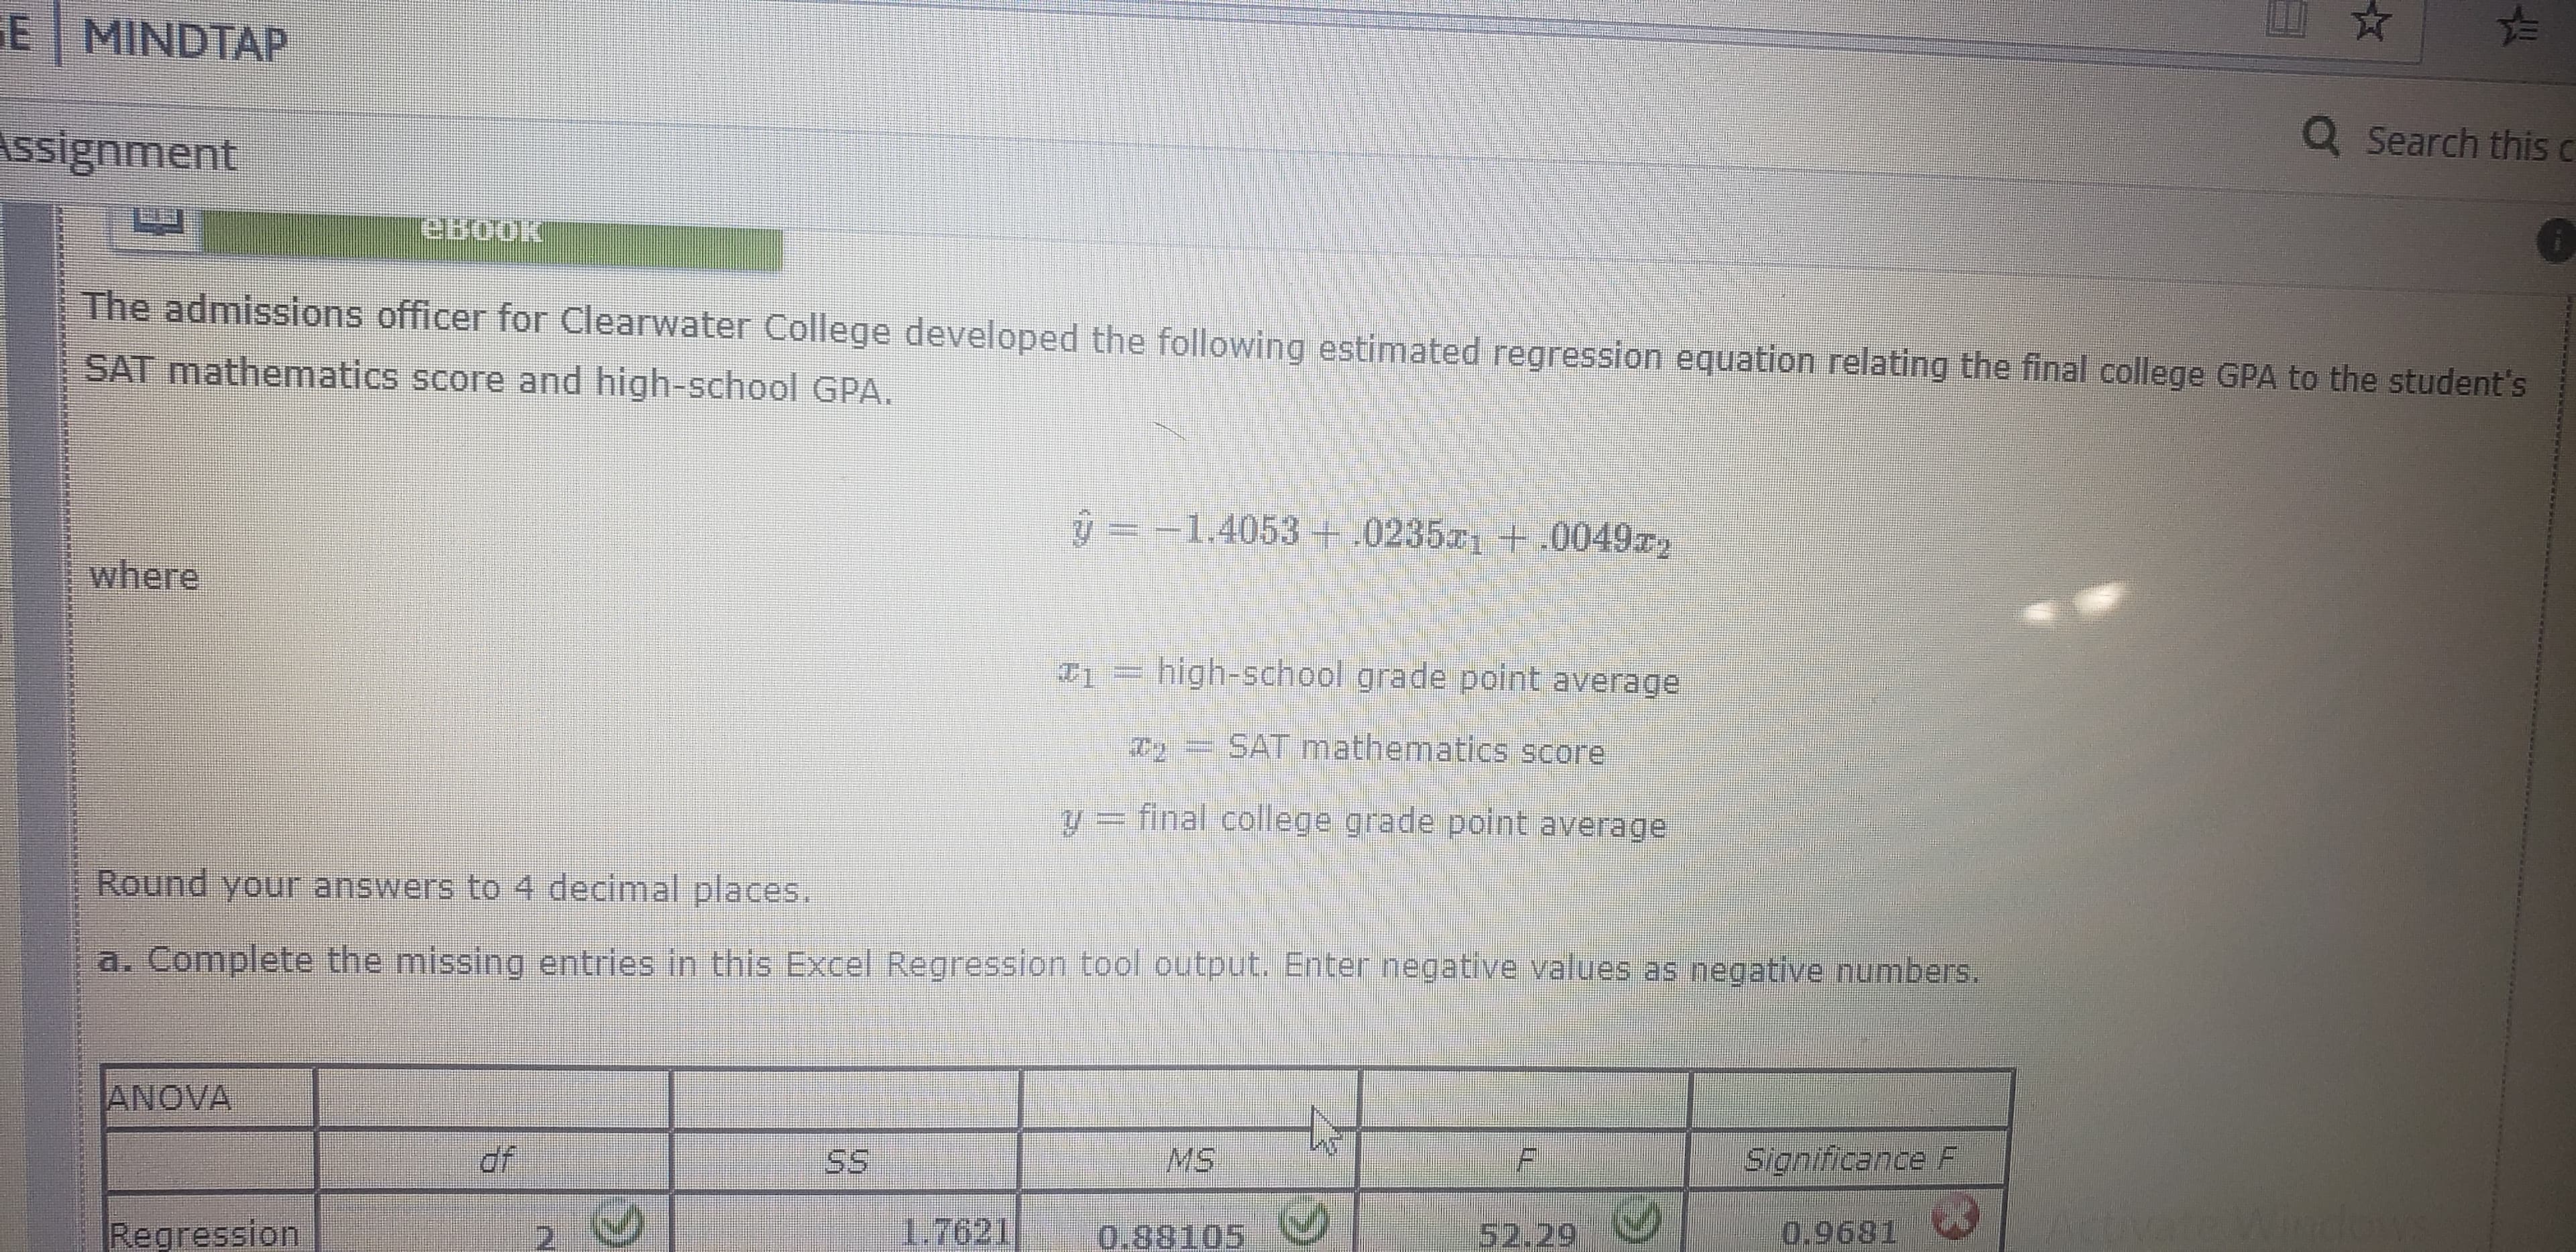
The admission officer for Clearwater College developed the following estimated regression equation relating tge funal college GPA to the students SAT mathematics score and high school GPA.
Y = -1.4053 + 0.235x1 + .0049x2
X1 = high school grade point average
X2 ,= SAT mathematics score
Y= final collage grade point average
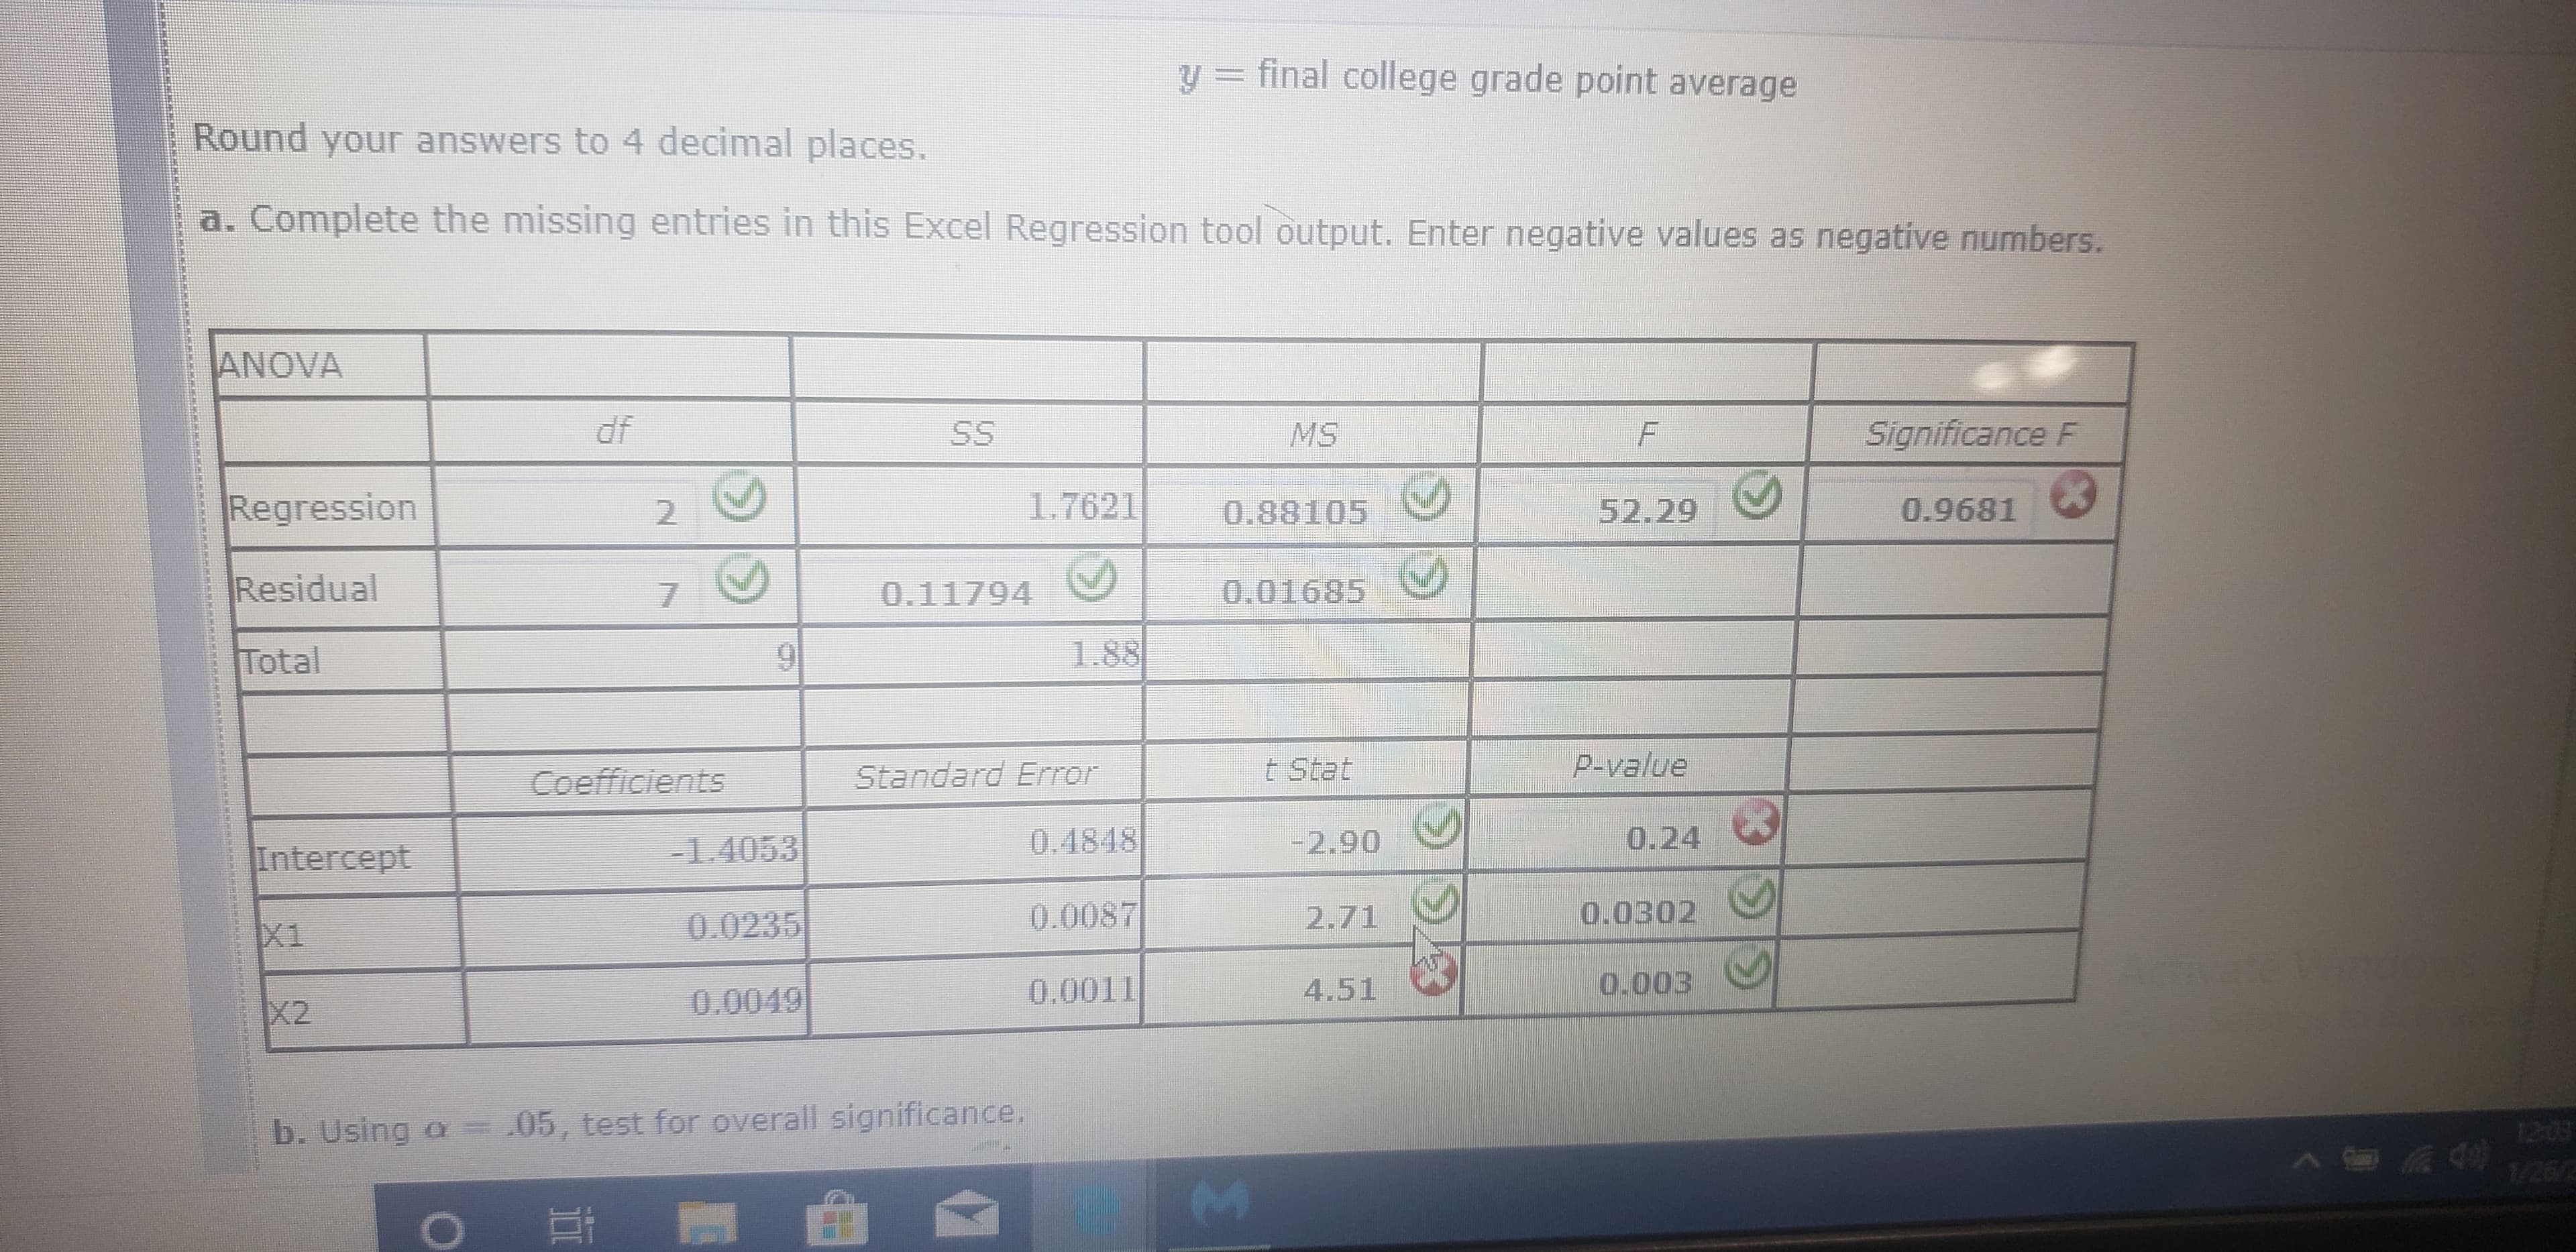
Round your answers to 4 decimal places.
A. Complete the missing entries in this excel regression tool output. Enter negative values aa negative numbers.
Significance F ?
T stat x2?
Thank you


Trending now
This is a popular solution!

Step by step
Solved in 3 steps with 1 images


