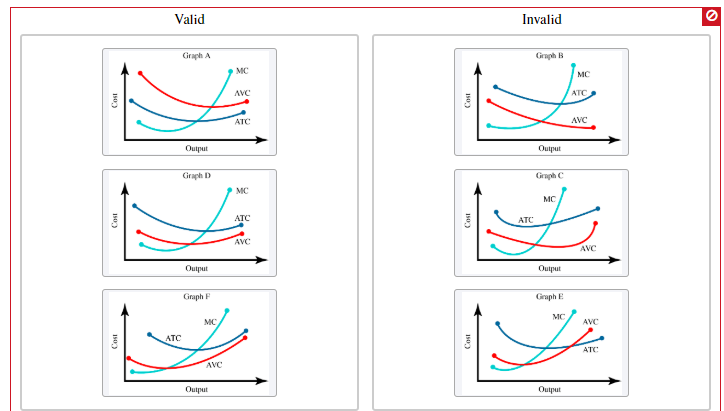
Each graph illustrates three short-run cost curves for firms, where ATC is average total cost (also referred to as average cost), MC is marginal cost, and AVC is average variable cost. Please classify each of the graphs as valid or invalid based on what you know about the relationships between these curves. Valid Invalid Graph A Gaph B мC мC ATC AVC AVC ATC Ouци Output Craph D Gaph C мC ATC ATC AVC AVC Оири Оириг Giraph P Graph E MC мC AVC ATC ATC AVC Output Output I50) I50) I50) I50) I50) I50)
Each graph illustrates three short-run cost curves for firms, where ATC is average total cost (also referred to as average cost), MC is marginal cost, and AVC is average variable cost. Please classify each of the graphs as valid or invalid based on what you know about the relationships between these curves. Valid Invalid Graph A Gaph B мC мC ATC AVC AVC ATC Ouци Output Craph D Gaph C мC ATC ATC AVC AVC Оири Оириг Giraph P Graph E MC мC AVC ATC ATC AVC Output Output I50) I50) I50) I50) I50) I50)

Chapter6: Proudction Costs
Section: Chapter Questions
Problem 4SQ

Related questions
Question

Transcribed Image Text:Each graph illustrates three short-run cost curves for firms, where ATC is average total cost (also referred to as average
cost), MC is marginal cost, and AVC is average variable cost.
Please classify each of the graphs as valid or invalid based on what you know about the relationships between these curves.
Transcribed Image Text:Valid
Invalid
Graph A
Gaph B
мC
мC
ATC
AVC
AVC
ATC
Ouци
Output
Craph D
Gaph C
мC
ATC
ATC
AVC
AVC
Оири
Оириг
Giraph P
Graph E
MC
мC
AVC
ATC
ATC
AVC
Output
Output
I50)
I50)
I50)
I50)
I50)
I50)
Expert Solution
This question has been solved!
Explore an expertly crafted, step-by-step solution for a thorough understanding of key concepts.

This is a popular solution!

Trending now
This is a popular solution!

Step by step
Solved in 2 steps

Recommended textbooks for you


Managerial Economics: A Problem Solving Approach
Economics
ISBN:
9781337106665
Author:
Luke M. Froeb, Brian T. McCann, Michael R. Ward, Mike Shor
Publisher:
Cengage Learning
Managerial Economics: A Problem Solving Approach
Economics
ISBN:
9781337106665
Author:
Luke M. Froeb, Brian T. McCann, Michael R. Ward, Mike Shor
Publisher:
Cengage Learning


Economics (MindTap Course List)
Economics
ISBN:
9781337617383
Author:
Roger A. Arnold
Publisher:
Cengage Learning