Each of the following graphs show the relationship between two variables. Determine the Pearson product-moment correlation coefficient (7) for each graph.
Each of the following graphs show the relationship between two variables. Determine the Pearson product-moment correlation coefficient (7) for each graph.

Algebra & Trigonometry with Analytic Geometry
13th Edition
ISBN:9781133382119
Author:Swokowski
Publisher:Swokowski
Chapter3: Functions And Graphs
Section3.5: Graphs Of Functions
Problem 58E

Related questions
Question
Transcribed Image Text:ment Score:
85%
O Attempt 2
on 1 of 14
>
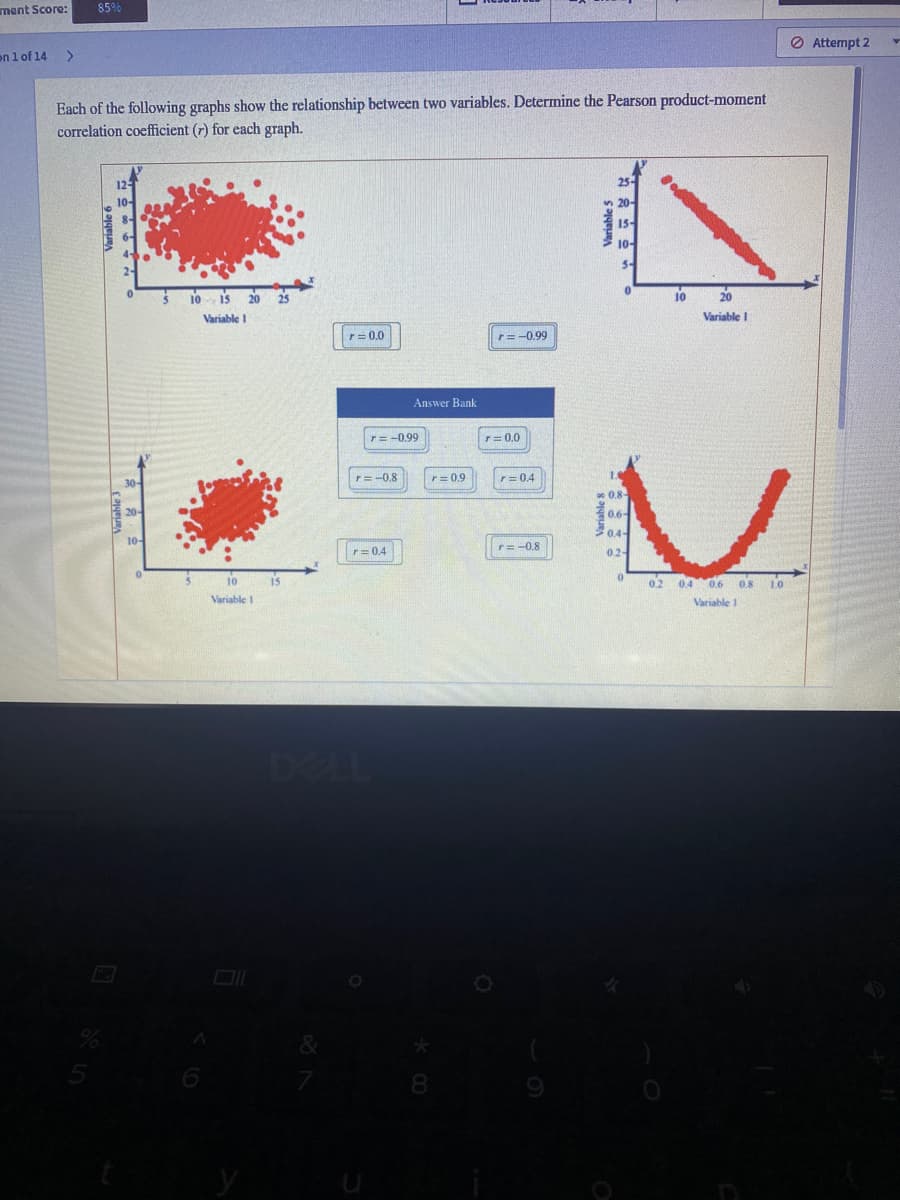
Each of the following graphs show the relationship between two variables. Determine the Pearson product-moment
correlation coefficient (r) for each graph.
25-
n 20-
15-
10-
5-
10
10
20
Variable I
Variable I
r= 0.0
r=-0.99
Answer Bank
r=-0.99
r 0.0
r= -0.8
r= 0.9
r= 0.4
30-
e 0.8-
0.6-
04-
10-
r=-0.8
r= 0.4
02-
10
02 04 0.6 08
10
Variable
Variable 1
DELL
Variable 6
Variable 5
Expert Solution
This question has been solved!
Explore an expertly crafted, step-by-step solution for a thorough understanding of key concepts.

This is a popular solution!

Trending now
This is a popular solution!

Step by step
Solved in 2 steps

Recommended textbooks for you
Algebra & Trigonometry with Analytic Geometry
Algebra
ISBN:
9781133382119
Author:
Swokowski
Publisher:
Cengage

Glencoe Algebra 1, Student Edition, 9780079039897…
Algebra
ISBN:
9780079039897
Author:
Carter
Publisher:
McGraw Hill

Functions and Change: A Modeling Approach to Coll…
Algebra
ISBN:
9781337111348
Author:
Bruce Crauder, Benny Evans, Alan Noell
Publisher:
Cengage Learning
Algebra & Trigonometry with Analytic Geometry
Algebra
ISBN:
9781133382119
Author:
Swokowski
Publisher:
Cengage
Glencoe Algebra 1, Student Edition, 9780079039897…
Algebra
ISBN:
9780079039897
Author:
Carter
Publisher:
McGraw Hill
Functions and Change: A Modeling Approach to Coll…
Algebra
ISBN:
9781337111348
Author:
Bruce Crauder, Benny Evans, Alan Noell
Publisher:
Cengage Learning