R 5. Costs in the short run versus in the long run Ike's Bikes is a major manufacturer of bicycles. Currently, the company produces bikes using only one factory. However, it is considering expanding production to two or even three factories. The following table shows the company's short-run average total cost (SRATC) each month for various levels of production if it uses one, two, or three factories. (Note: Q equals the total quantity of bikes produced by all factories.) Average Total Cost (Dollars per bike) Number of Factories Q = 25 Q = 50 Q = 75 Q = 125 Q = 150 %3D %3D 130 1. 140 08 001 2. 165 120 120 165 08 08 140 3. 130 007 08 00T Suppose Ike's Bikes is currently producing 25 bikes per month in its only factory. Its short-run average total cost is $ per bike. Suppose Ike's Bikes is expecting to produce 25 bikes per month for several years. In this case, in the long run, it would choose to produce bikes using On the following graph, plot the three SRATC curves for Ike's Bikes from the previous table. Specifically, use the green points (triangle symbol) to plot its SRATC curve if it operates one factory (SRATC1); use the purple points (diamond symbol) to plot its SRATC curve if it operates two factories ( SRATC2); and use the orange points (square symbol) to plot its SRATC curve if it operates three factories (SRATC3). Finally, plot the long-run average total cost (LRATC) curve for Ike's Bikes using the blue points (circle symbol). Note: Plot your points in the order in which you would like them connected. Line segments will connect the points automatically. MacBook Pro Search or type URL 2. 3. 4. 9. 00 B. +) 3 50 20 AVERAGE TOTAL COST (Dollars per bike) Note: Plot your points in the order in which you would like them connected. Line segments will connect the points automatically. 180 SRATC, 140 SRATC, 120 SRATC, 09 LRATC 75 00L QUANTITY (Bikes) 25 125 150 175 In the following table, indicate whether the long-run average cost curve exhibits economies of scale, constant returns to scale, or diseconomies of scale for each range of bike production. Range Economies of Scale Constant Returns to Scale Diseconomies of Scale Fewer than 75 bikes per month More than 100 bikes per month Between 75 and 100 bikes per month MacBook Pro G Search or type URL 9-
R 5. Costs in the short run versus in the long run Ike's Bikes is a major manufacturer of bicycles. Currently, the company produces bikes using only one factory. However, it is considering expanding production to two or even three factories. The following table shows the company's short-run average total cost (SRATC) each month for various levels of production if it uses one, two, or three factories. (Note: Q equals the total quantity of bikes produced by all factories.) Average Total Cost (Dollars per bike) Number of Factories Q = 25 Q = 50 Q = 75 Q = 125 Q = 150 %3D %3D 130 1. 140 08 001 2. 165 120 120 165 08 08 140 3. 130 007 08 00T Suppose Ike's Bikes is currently producing 25 bikes per month in its only factory. Its short-run average total cost is $ per bike. Suppose Ike's Bikes is expecting to produce 25 bikes per month for several years. In this case, in the long run, it would choose to produce bikes using On the following graph, plot the three SRATC curves for Ike's Bikes from the previous table. Specifically, use the green points (triangle symbol) to plot its SRATC curve if it operates one factory (SRATC1); use the purple points (diamond symbol) to plot its SRATC curve if it operates two factories ( SRATC2); and use the orange points (square symbol) to plot its SRATC curve if it operates three factories (SRATC3). Finally, plot the long-run average total cost (LRATC) curve for Ike's Bikes using the blue points (circle symbol). Note: Plot your points in the order in which you would like them connected. Line segments will connect the points automatically. MacBook Pro Search or type URL 2. 3. 4. 9. 00 B. +) 3 50 20 AVERAGE TOTAL COST (Dollars per bike) Note: Plot your points in the order in which you would like them connected. Line segments will connect the points automatically. 180 SRATC, 140 SRATC, 120 SRATC, 09 LRATC 75 00L QUANTITY (Bikes) 25 125 150 175 In the following table, indicate whether the long-run average cost curve exhibits economies of scale, constant returns to scale, or diseconomies of scale for each range of bike production. Range Economies of Scale Constant Returns to Scale Diseconomies of Scale Fewer than 75 bikes per month More than 100 bikes per month Between 75 and 100 bikes per month MacBook Pro G Search or type URL 9-

Managerial Economics: Applications, Strategies and Tactics (MindTap Course List)
14th Edition
ISBN:9781305506381
Author:James R. McGuigan, R. Charles Moyer, Frederick H.deB. Harris
Publisher:James R. McGuigan, R. Charles Moyer, Frederick H.deB. Harris
Chapter11: Price And Output Determination: Monopoly And Dominant Firms
Section: Chapter Questions
Problem 6E

Related questions

Question
Please help with this.
Transcribed Image Text:R
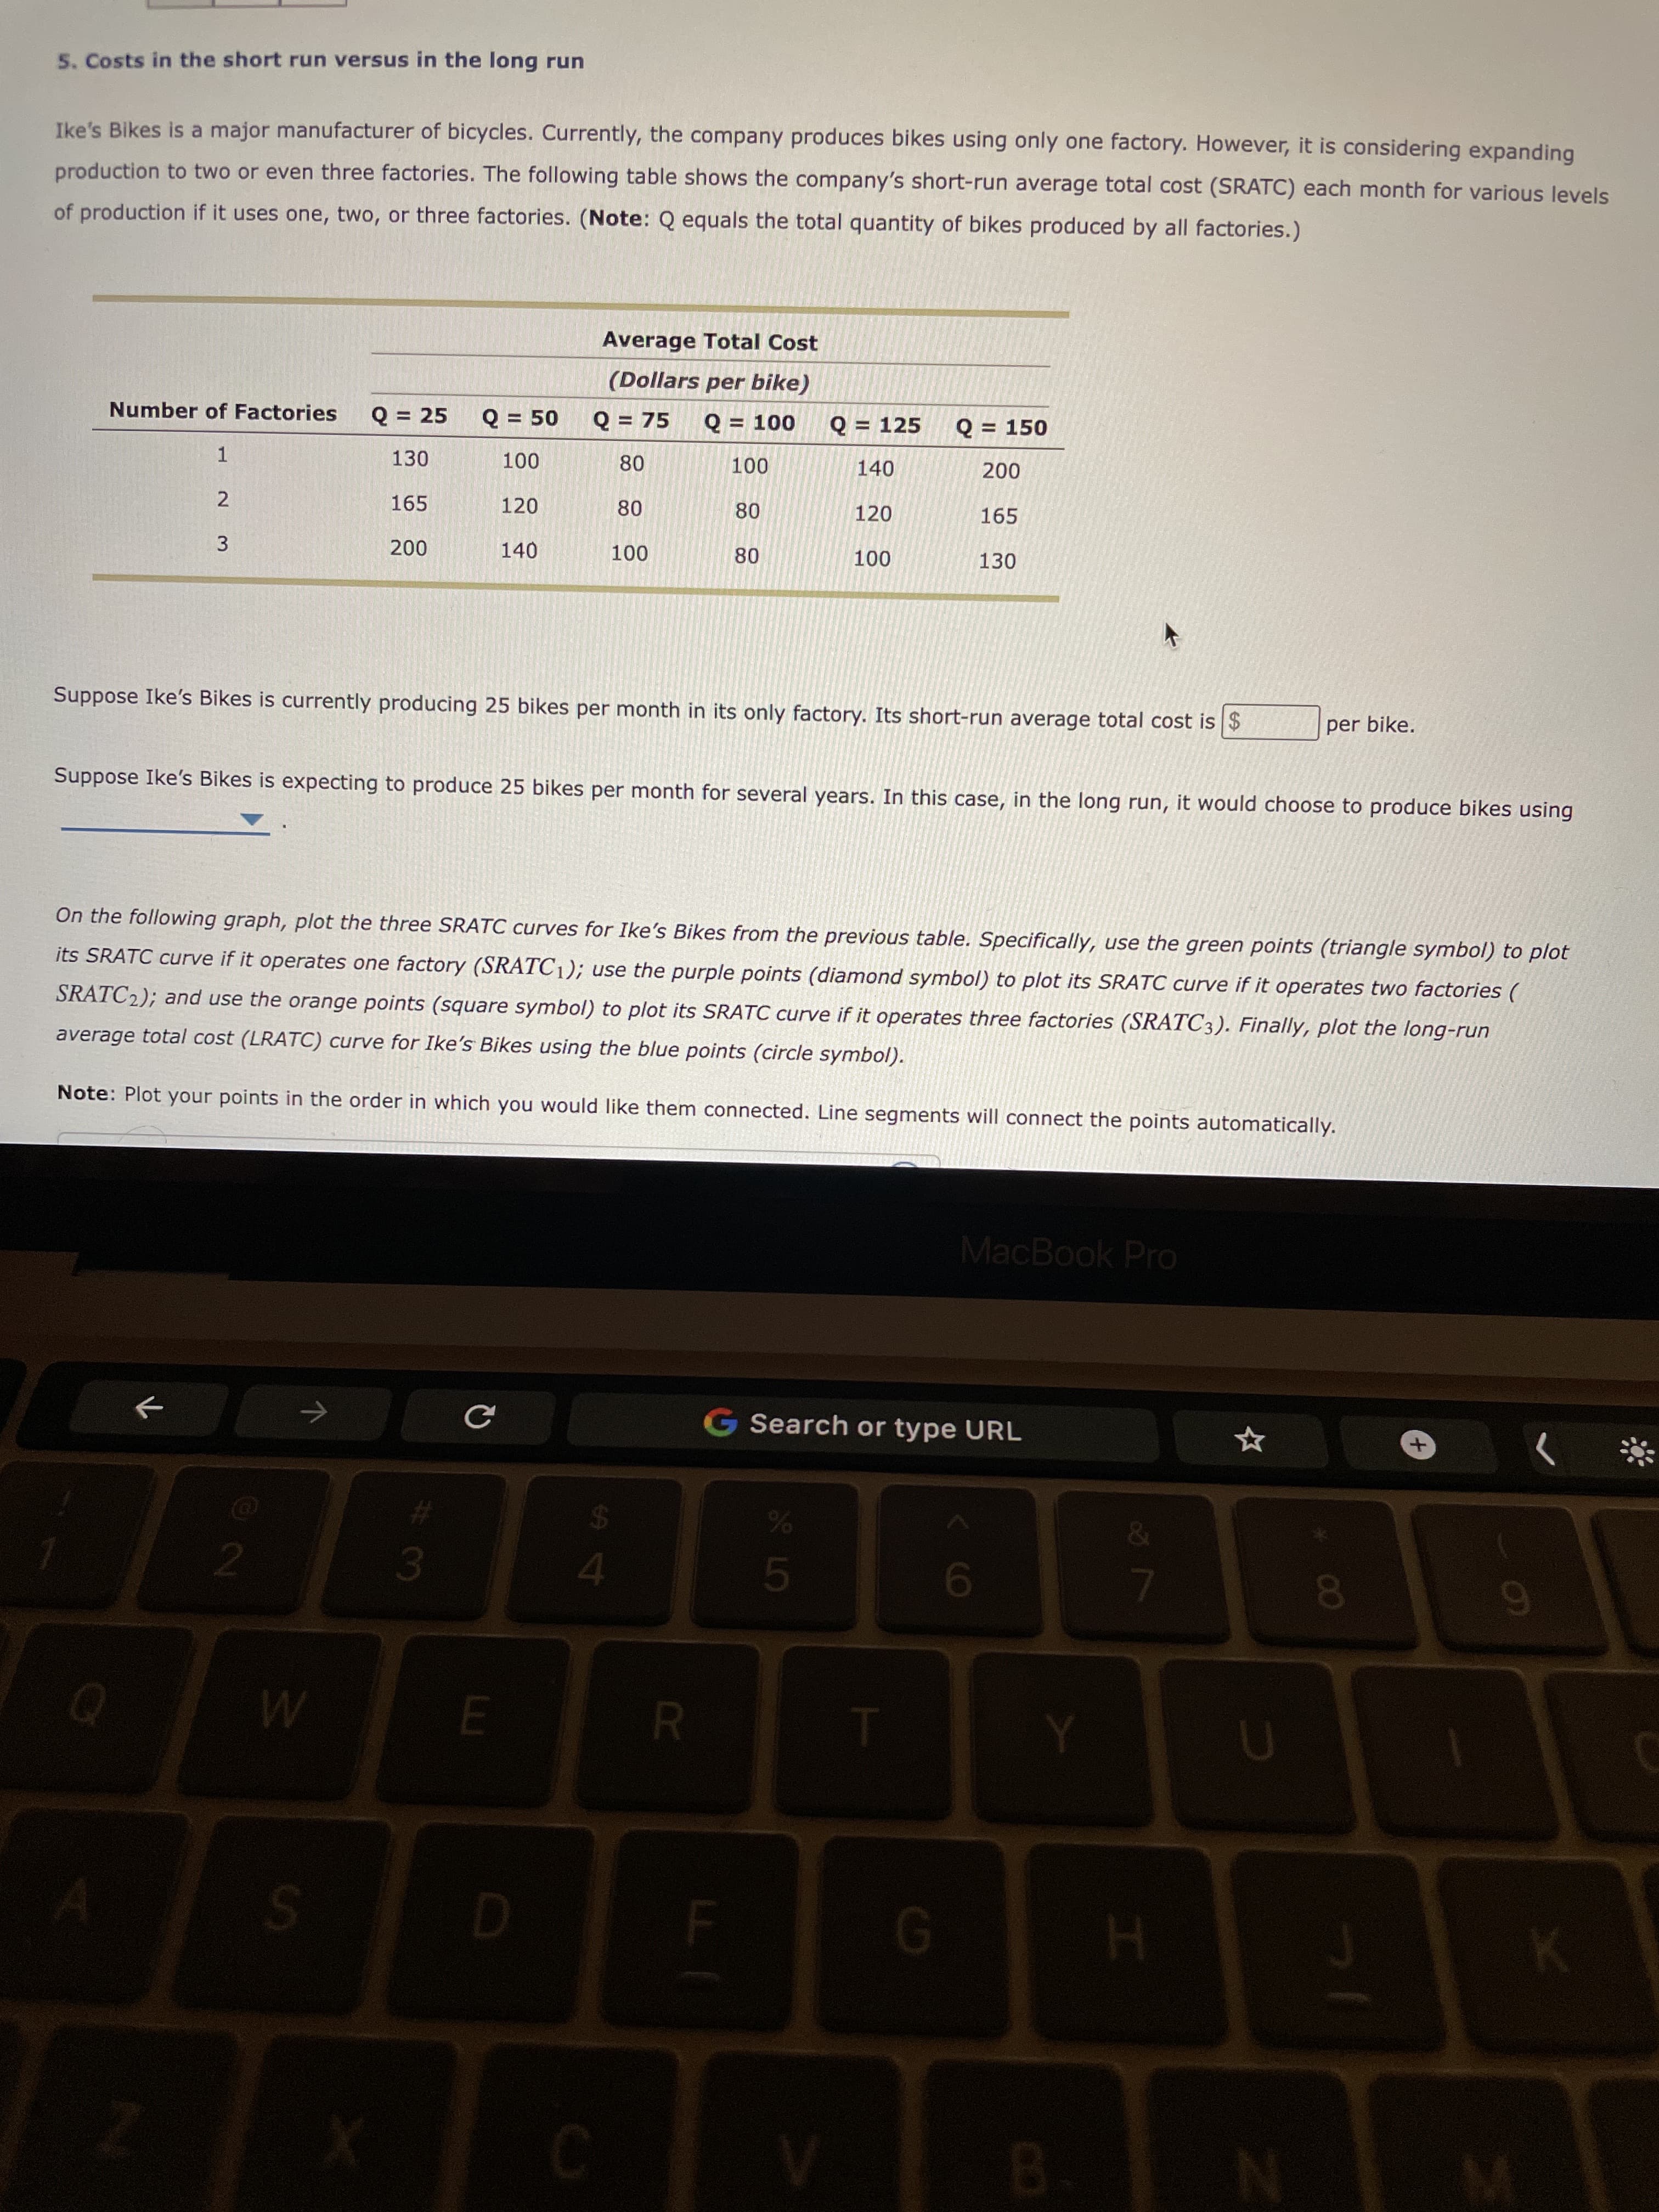
5. Costs in the short run versus in the long run
Ike's Bikes is a major manufacturer of bicycles. Currently, the company produces bikes using only one factory. However, it is considering expanding
production to two or even three factories. The following table shows the company's short-run average total cost (SRATC) each month for various levels
of production if it uses one, two, or three factories. (Note: Q equals the total quantity of bikes produced by all factories.)
Average Total Cost
(Dollars per bike)
Number of Factories
Q = 25
Q = 50
Q = 75
Q = 125
Q = 150
%3D
%3D
130
1.
140
08
001
2.
165
120
120
165
08
08
140
3.
130
007
08
00T
Suppose Ike's Bikes is currently producing 25 bikes per month in its only factory. Its short-run average total cost is $
per bike.
Suppose Ike's Bikes is expecting to produce 25 bikes per month for several years. In this case, in the long run, it would choose to produce bikes using
On the following graph, plot the three SRATC curves for Ike's Bikes from the previous table. Specifically, use the green points (triangle symbol) to plot
its SRATC curve if it operates one factory (SRATC1); use the purple points (diamond symbol) to plot its SRATC curve if it operates two factories (
SRATC2); and use the orange points (square symbol) to plot its SRATC curve if it operates three factories (SRATC3). Finally, plot the long-run
average total cost (LRATC) curve for Ike's Bikes using the blue points (circle symbol).
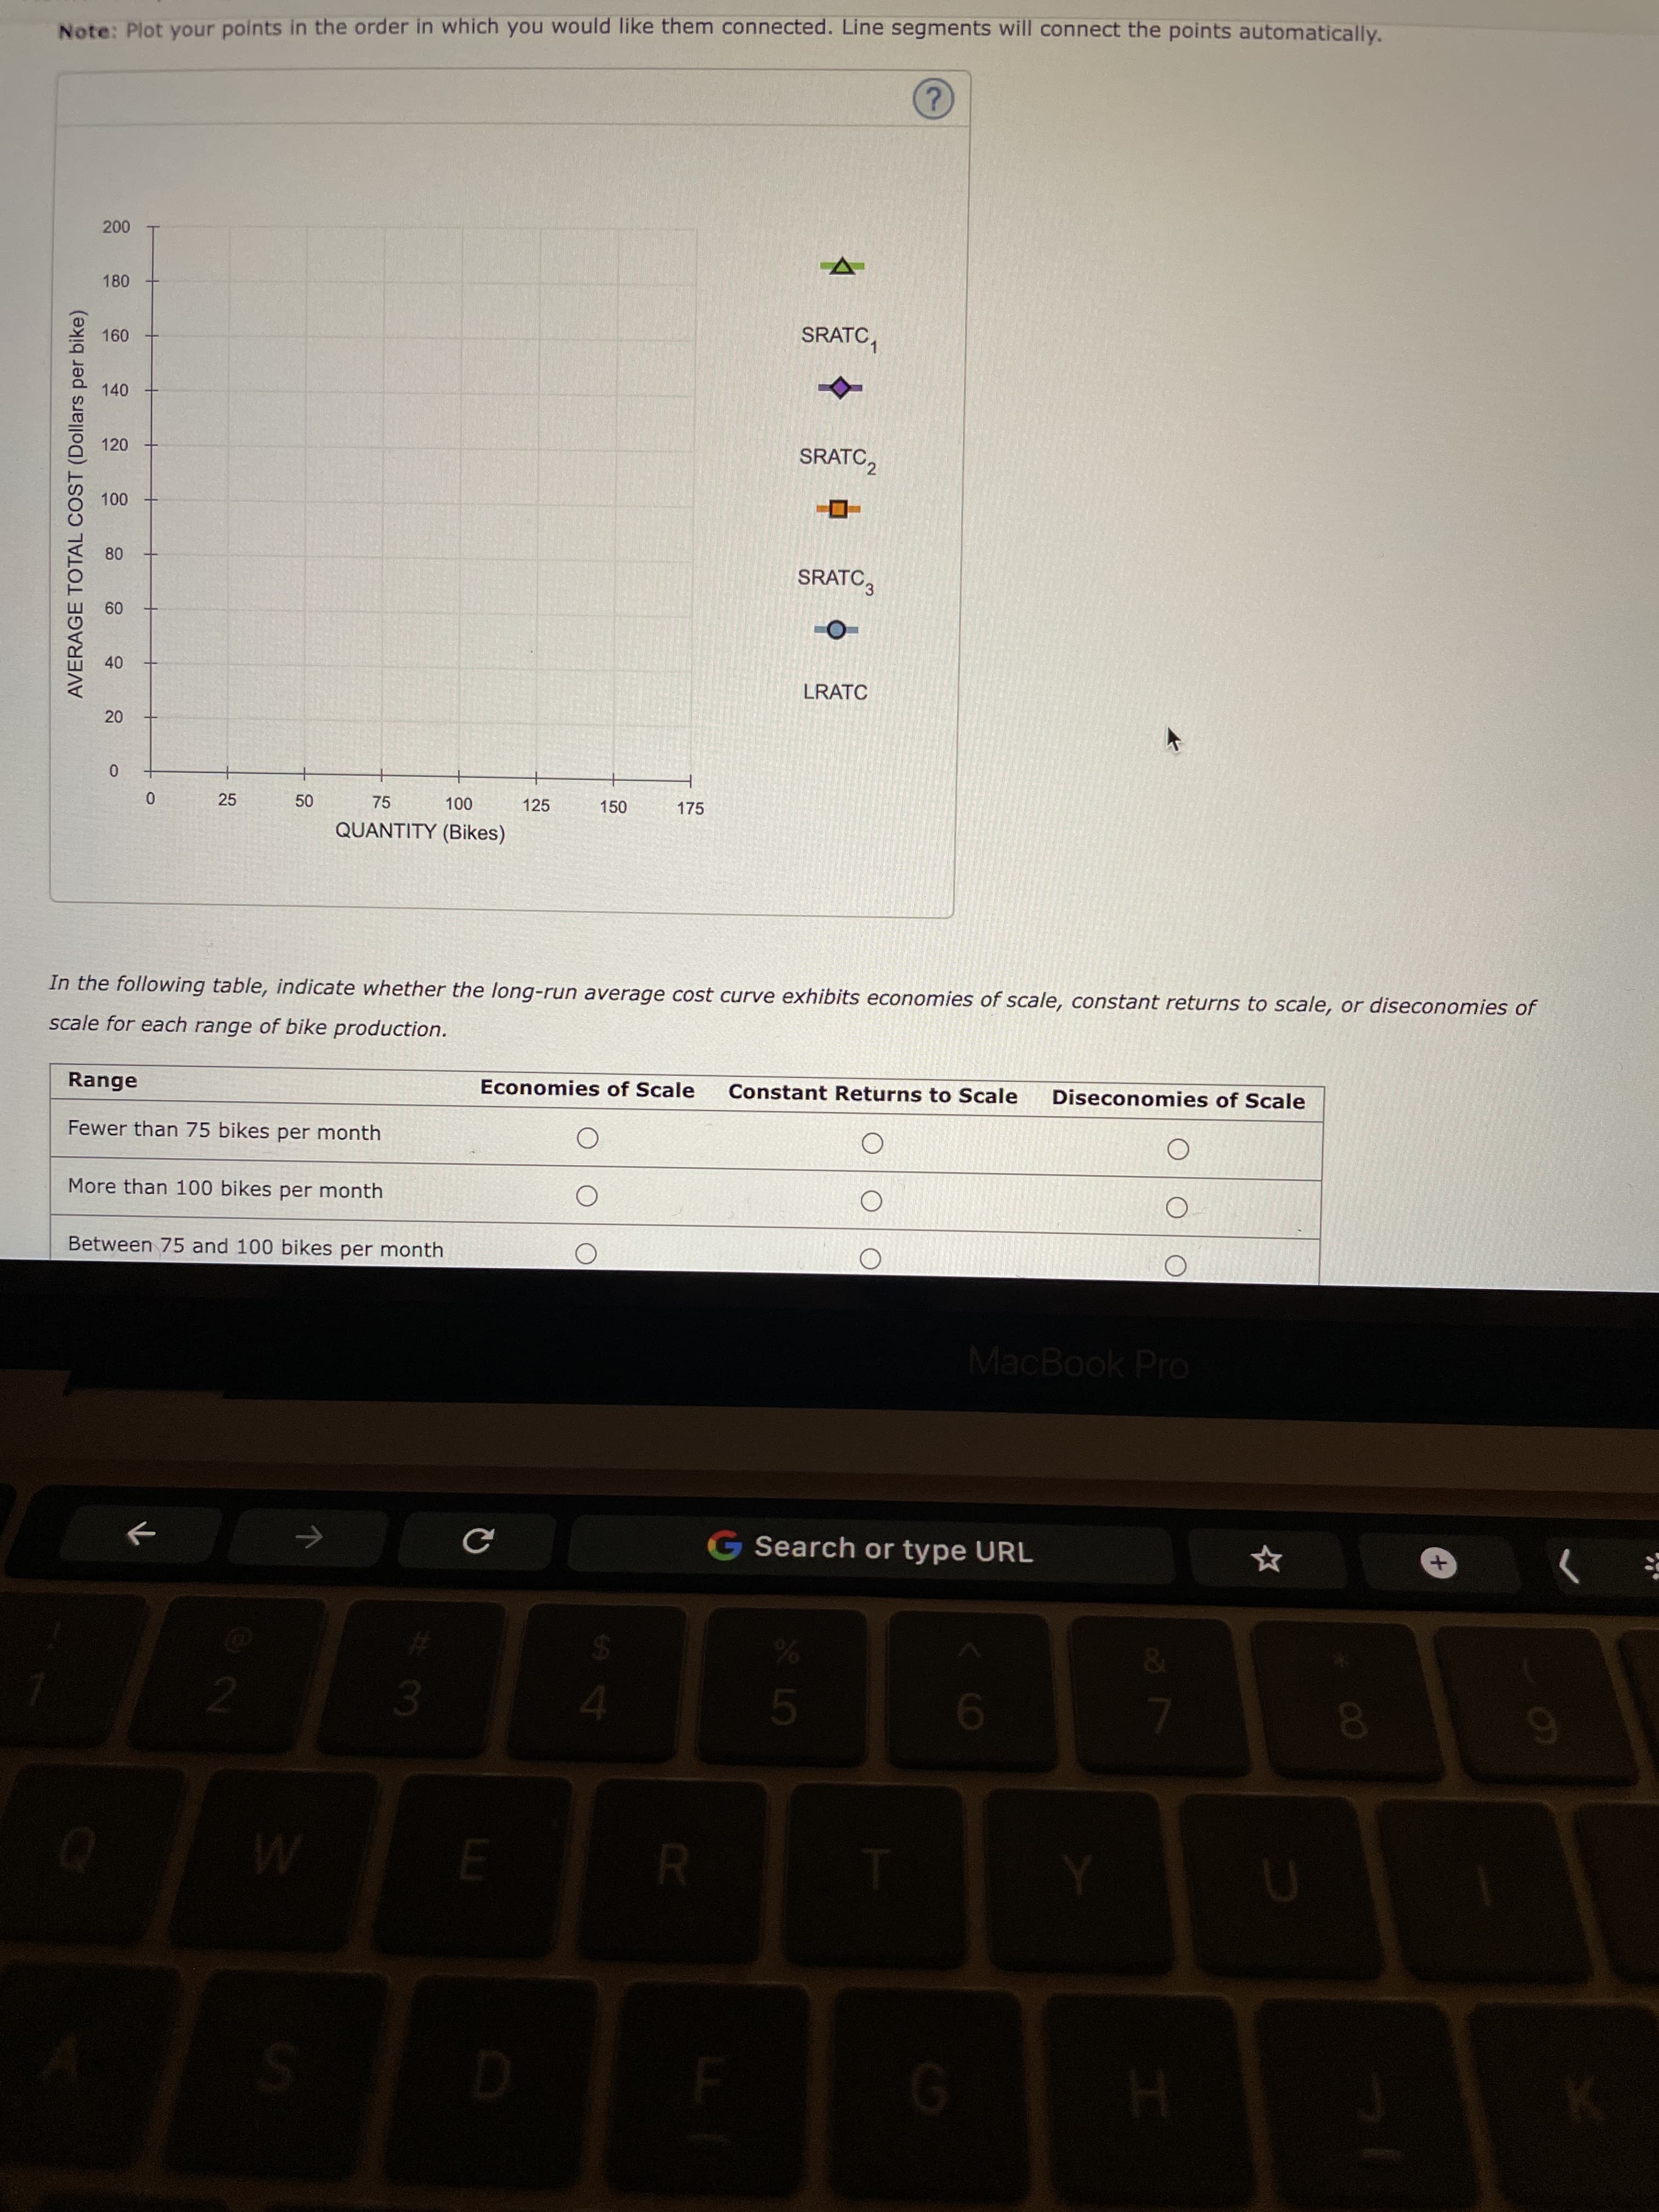
Note: Plot your points in the order in which you would like them connected. Line segments will connect the points automatically.
MacBook Pro
Search or type URL
2.
3.
4.
9.
00
B.
Transcribed Image Text:+)
3
50
20
AVERAGE TOTAL COST (Dollars per bike)
Note: Plot your points in the order in which you would like them connected. Line segments will connect the points automatically.
180
SRATC,
140
SRATC,
120
SRATC,
09
LRATC
75
00L
QUANTITY (Bikes)
25
125
150
175
In the following table, indicate whether the long-run average cost curve exhibits economies of scale, constant returns to scale, or diseconomies of
scale for each range of bike production.
Range
Economies of Scale
Constant Returns to Scale
Diseconomies of Scale
Fewer than 75 bikes per month
More than 100 bikes per month
Between 75 and 100 bikes per month
MacBook Pro
G Search or type URL
9-
Expert Solution
This question has been solved!
Explore an expertly crafted, step-by-step solution for a thorough understanding of key concepts.

This is a popular solution!

Trending now
This is a popular solution!

Step by step
Solved in 4 steps with 1 images

Knowledge Booster


Learn more about
Need a deep-dive on the concept behind this application? Look no further. Learn more about this topic, economics and related others by exploring similar questions and additional content below.Recommended textbooks for you
Managerial Economics: Applications, Strategies an…
Economics
ISBN:
9781305506381
Author:
James R. McGuigan, R. Charles Moyer, Frederick H.deB. Harris
Publisher:
Cengage Learning

Managerial Economics: A Problem Solving Approach
Economics
ISBN:
9781337106665
Author:
Luke M. Froeb, Brian T. McCann, Michael R. Ward, Mike Shor
Publisher:
Cengage Learning
Managerial Economics: Applications, Strategies an…
Economics
ISBN:
9781305506381
Author:
James R. McGuigan, R. Charles Moyer, Frederick H.deB. Harris
Publisher:
Cengage Learning
Managerial Economics: A Problem Solving Approach
Economics
ISBN:
9781337106665
Author:
Luke M. Froeb, Brian T. McCann, Michael R. Ward, Mike Shor
Publisher:
Cengage Learning