ermine Frequency of Class Data Frequency can be determined by calculating the number of times each allelic combination was obtained divided by the total number of times the dice was thrown. For instance, if the class results for sex determination were seven XX combinations and three XY combinations, the frequency would be calculated like so: Frequency XX = 7/10 0.70 Frequency XY = 3/10 0.30 Notice that the frequencies always add up to 1. Determine the frequencies for each trait. Use the highest frequency for each characteristic to determine the traits of an individual created by the entire class. Record your data in Table 2. Table 2. Genotypic and Phenotypic Description and Frequencies of Allelic Combinations of an Individual Created through Rolling of Dice-Class Results. Highest Frequency Characteristic Genotype Phenotype Gender-male or female Eyebrows-unibrow or two separate Eye shape-round or almond Hitchhiker's thumb-yes or no Earlobes-attached or detached Tongue roll-yes or no Widow's peak-yes or no Face shape-square, round, oval Eye color-blue, brown, green Chin shape-square, round, pointed Hair color-brown, blonde, red Hair texture-curly, wavy, straight Look at the results of your first Punnett square for sex determination. You should have come up with 50% females and 50% males (or a frequency of 0.50 for each sex). How does that compare to the frequency of males and females generated by the class?
ermine Frequency of Class Data Frequency can be determined by calculating the number of times each allelic combination was obtained divided by the total number of times the dice was thrown. For instance, if the class results for sex determination were seven XX combinations and three XY combinations, the frequency would be calculated like so: Frequency XX = 7/10 0.70 Frequency XY = 3/10 0.30 Notice that the frequencies always add up to 1. Determine the frequencies for each trait. Use the highest frequency for each characteristic to determine the traits of an individual created by the entire class. Record your data in Table 2. Table 2. Genotypic and Phenotypic Description and Frequencies of Allelic Combinations of an Individual Created through Rolling of Dice-Class Results. Highest Frequency Characteristic Genotype Phenotype Gender-male or female Eyebrows-unibrow or two separate Eye shape-round or almond Hitchhiker's thumb-yes or no Earlobes-attached or detached Tongue roll-yes or no Widow's peak-yes or no Face shape-square, round, oval Eye color-blue, brown, green Chin shape-square, round, pointed Hair color-brown, blonde, red Hair texture-curly, wavy, straight Look at the results of your first Punnett square for sex determination. You should have come up with 50% females and 50% males (or a frequency of 0.50 for each sex). How does that compare to the frequency of males and females generated by the class?

Human Anatomy & Physiology (11th Edition)
11th Edition
ISBN:9780134580999
Author:Elaine N. Marieb, Katja N. Hoehn
Publisher:Elaine N. Marieb, Katja N. Hoehn
Chapter1: The Human Body: An Orientation
Section: Chapter Questions
Problem 1RQ: The correct sequence of levels forming the structural hierarchy is A. (a) organ, organ system,...

Related questions
Question
Someone completed this question partially because of me cropping it wrong. Here it is completely
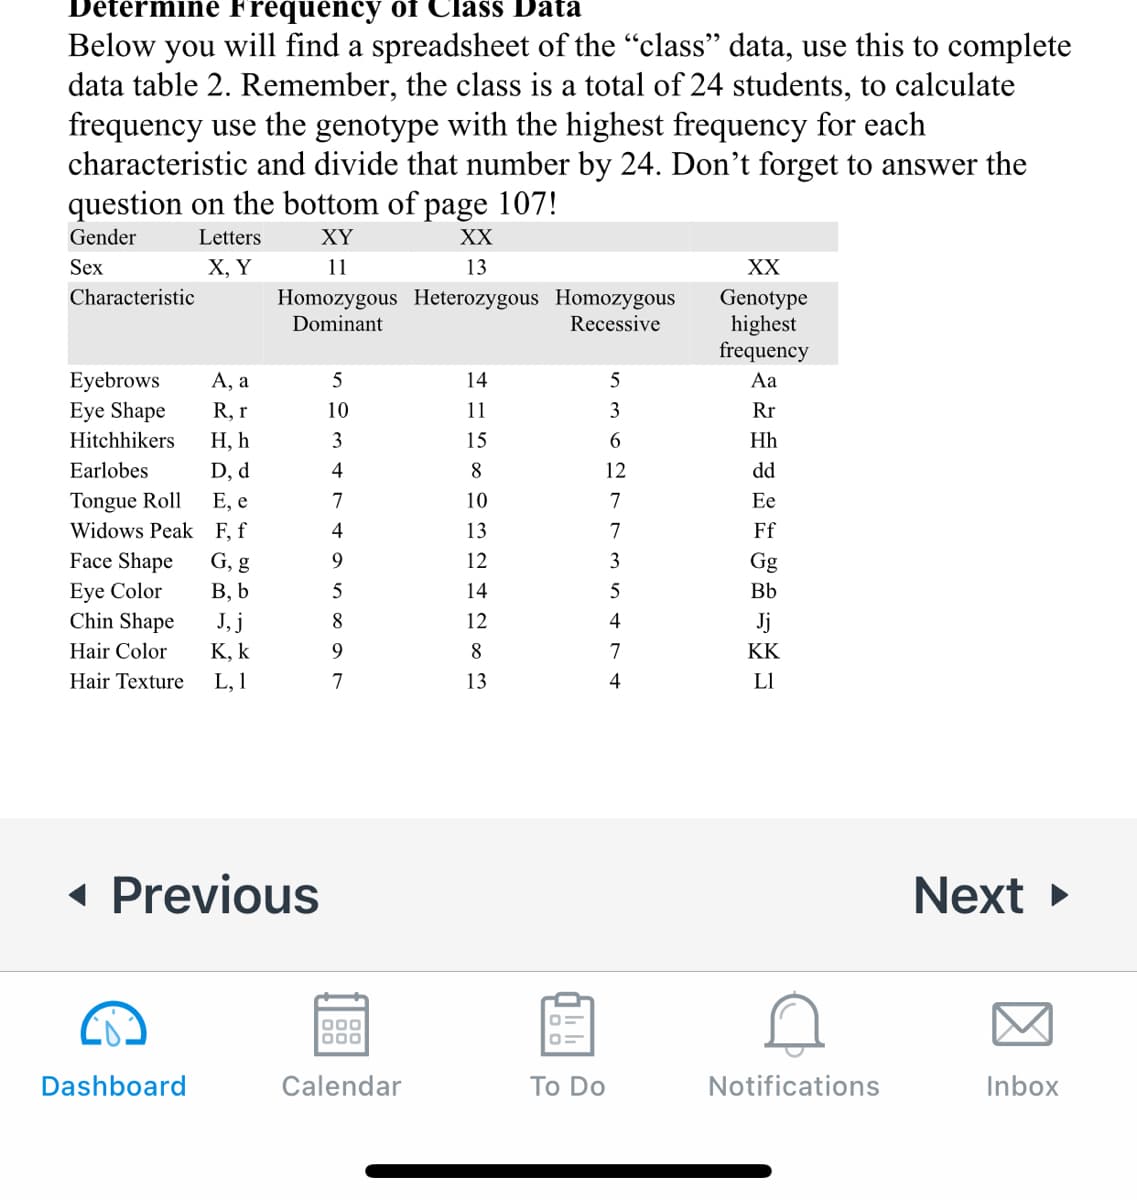
Transcribed Image Text:Determine Frequency of Class Data
Below you will find a spreadsheet of the "class" data, use this to complete
data table 2. Remember, the class is a total of 24 students, to calculate
frequency use the genotype with the highest frequency for each
characteristic and divide that number by 24. Don't forget to answer the
question on the bottom of page 107!
Gender
Letters
XY
XX
Sex
Х, Y
11
13
XX
Characteristic
Homozygous Heterozygous Homozygous
Dominant
Genotype
highest
frequency
Recessive
A, a
Eyebrows
Eye Shape
14
Aa
R, r
10
11
3
Rr
Hitchhikers
Н, h
3
15
Hh
Earlobes
D, d
4
8
12
dd
Tongue Roll
Widows Peak F, f
E, e
7
10
7
Ee
4
13
7
Ff
Face Shape
G, g
9.
12
3
Gg
Eye Color
Chin Shape
В, b
5
14
5
Bb
J, j
8
12
4
Jj
Hair Color
K, k
9.
8
7
KK
Hair Texture
L, 1
7
13
4
LI
« Previous
Next >
Dashboard
Calendar
Тo Do
Notifications
Inbox
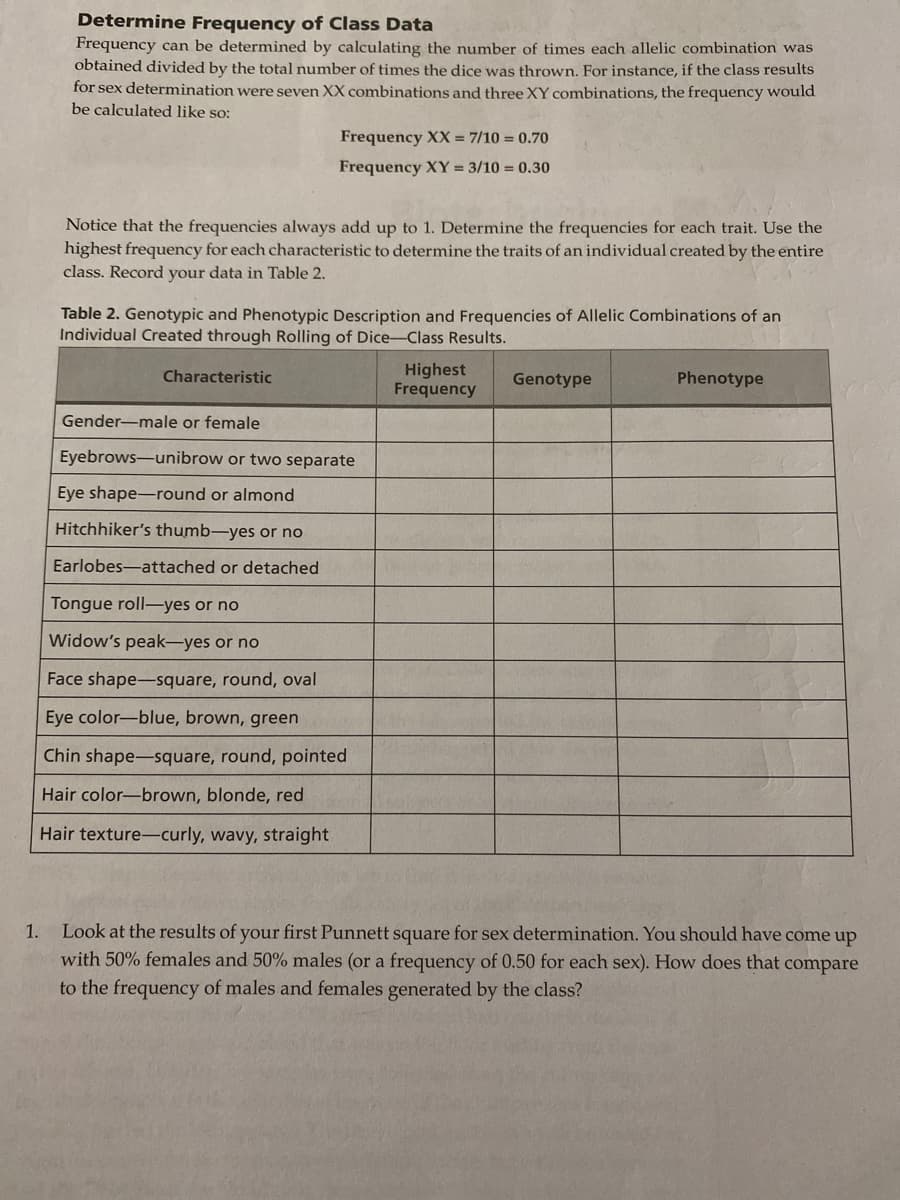
Transcribed Image Text:Determine Frequency of Class Data
Frequency can be determined by calculating the number of times each allelic combination was
obtained divided by the total number of times the dice was thrown. For instance, if the class results
for sex determination were seven XX combinations and three XY combinations, the frequency would
be calculated like so:
Frequency XX = 7/10 = 0.70o
Frequency XY = 3/10 = 0.30
Notice that the frequencies always add up to 1. Determine the frequencies for each trait. Use the
highest frequency for each characteristic to determine the traits of an individual created by the entire
class. Record your data in Table 2.
Table 2. Genotypic and Phenotypic Description and Frequencies of Allelic Combinations of an
Individual Created through Rolling of Dice-Class Results.
Highest
Frequency
Characteristic
Genotype
Phenotype
Gender-male or female
Eyebrows-unibrow or two separate
Eye shape-round or almond
Hitchhiker's thumb-yes or no
Earlobes-attached or detached
Tongue roll-yes or no
Widow's peak-yes or no
Face shape-square, round, oval
Eye color-blue, brown, green
Chin shape-square, round, pointed
Hair color-brown, blonde, red
Hair texture-curly, wavy, straight
Look at the results of your first Punnett square for sex determination. You should have come up
with 50% females and 50% males (or a frequency of 0.50 for each sex). How does that compare
1.
to the frequency of males and females generated by the class?
Expert Solution
This question has been solved!
Explore an expertly crafted, step-by-step solution for a thorough understanding of key concepts.

This is a popular solution!

Trending now
This is a popular solution!

Step by step
Solved in 2 steps

Knowledge Booster


Learn more about
Need a deep-dive on the concept behind this application? Look no further. Learn more about this topic, biology and related others by exploring similar questions and additional content below.Recommended textbooks for you
Human Anatomy & Physiology (11th Edition)
Biology
ISBN:
9780134580999
Author:
Elaine N. Marieb, Katja N. Hoehn
Publisher:
PEARSON

Biology 2e
Biology
ISBN:
9781947172517
Author:
Matthew Douglas, Jung Choi, Mary Ann Clark
Publisher:
OpenStax

Anatomy & Physiology
Biology
ISBN:
9781259398629
Author:
McKinley, Michael P., O'loughlin, Valerie Dean, Bidle, Theresa Stouter
Publisher:
Mcgraw Hill Education,
Human Anatomy & Physiology (11th Edition)
Biology
ISBN:
9780134580999
Author:
Elaine N. Marieb, Katja N. Hoehn
Publisher:
PEARSON
Biology 2e
Biology
ISBN:
9781947172517
Author:
Matthew Douglas, Jung Choi, Mary Ann Clark
Publisher:
OpenStax
Anatomy & Physiology
Biology
ISBN:
9781259398629
Author:
McKinley, Michael P., O'loughlin, Valerie Dean, Bidle, Theresa Stouter
Publisher:
Mcgraw Hill Education,

Molecular Biology of the Cell (Sixth Edition)
Biology
ISBN:
9780815344322
Author:
Bruce Alberts, Alexander D. Johnson, Julian Lewis, David Morgan, Martin Raff, Keith Roberts, Peter Walter
Publisher:
W. W. Norton & Company

Laboratory Manual For Human Anatomy & Physiology
Biology
ISBN:
9781260159363
Author:
Martin, Terry R., Prentice-craver, Cynthia
Publisher:
McGraw-Hill Publishing Co.

Inquiry Into Life (16th Edition)
Biology
ISBN:
9781260231700
Author:
Sylvia S. Mader, Michael Windelspecht
Publisher:
McGraw Hill Education