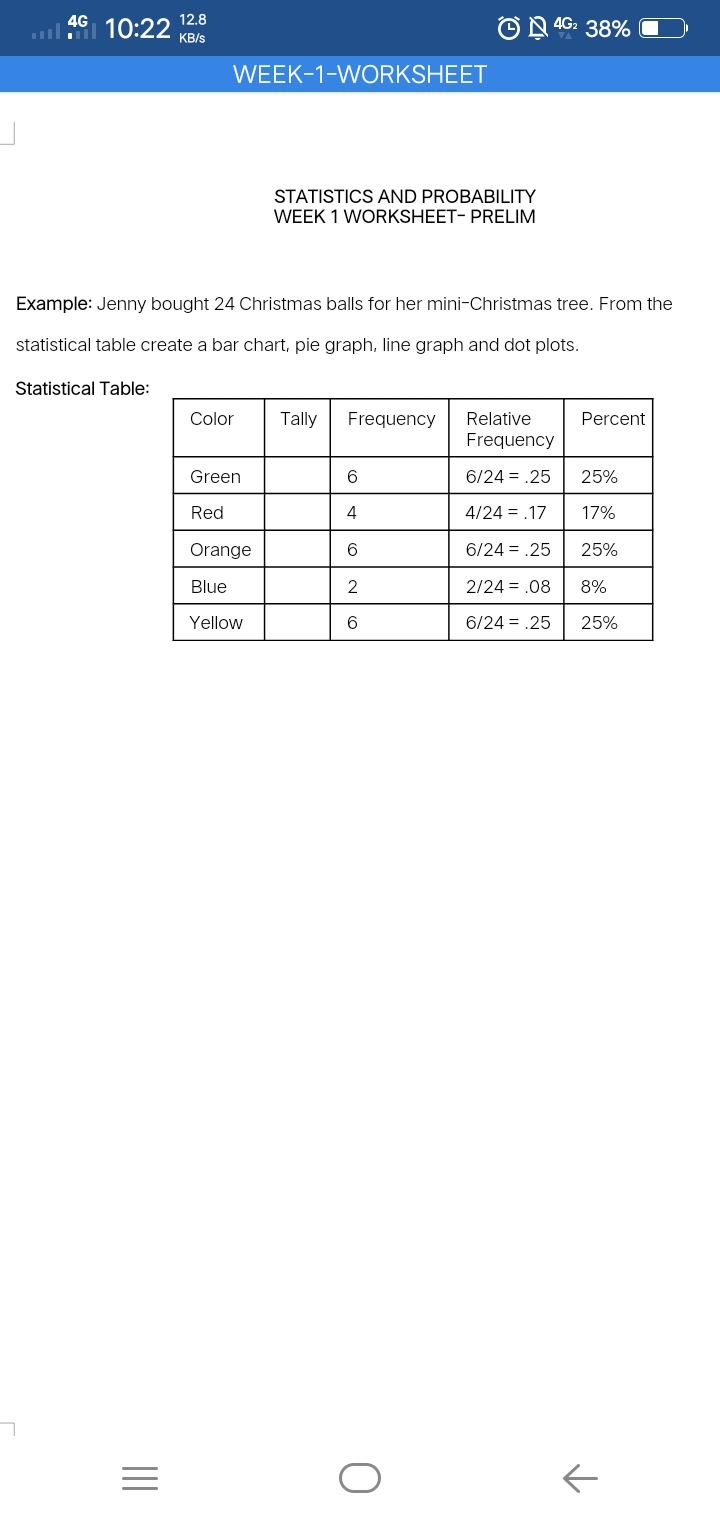
Example: Jenny bought 24 Christmas balls for her mini-Christmas tree. From the statistical table create a bar chart, pie graph, line graph and dot plots. Statistical Table: Color Tally Frequency Relative Percent Frequency Green 6/24 = .25 25% Red 4 4/24 = .17 17% Orange 6/24 = .25 25% Blue 2 2/24 = .08 8% Yellow 6/24 = .25 25%
Example: Jenny bought 24 Christmas balls for her mini-Christmas tree. From the statistical table create a bar chart, pie graph, line graph and dot plots. Statistical Table: Color Tally Frequency Relative Percent Frequency Green 6/24 = .25 25% Red 4 4/24 = .17 17% Orange 6/24 = .25 25% Blue 2 2/24 = .08 8% Yellow 6/24 = .25 25%

Linear Algebra: A Modern Introduction
4th Edition
ISBN:9781285463247
Author:David Poole
Publisher:David Poole
Chapter7: Distance And Approximation
Section7.3: Least Squares Approximation
Problem 31EQ

Related questions

Question
Transcribed Image Text:12.8
...l 10:22 KB/S
4G
OD 4G: 38%
WEEK-1-WORKSHEET
STATISTICS AND PROBABILITY
WEEK 1 WORKSHEET- PRELIM
Example: Jenny bought 24 Christmas balls for her mini-Christmas tree. From the
statistical table create a bar chart, pie graph, line graph and dot plots.
Statistical Table:
Color
Tally
Frequency
Relative
Percent
Frequency
Green
6/24 = .25
25%
Red
4
4/24 = .17
17%
Orange
6
6/24 = .25
25%
Blue
2
2/24 = .08
8%
Yellow
6
6/24 = .25
25%
Expert Solution
This question has been solved!
Explore an expertly crafted, step-by-step solution for a thorough understanding of key concepts.

Step by step
Solved in 5 steps with 5 images

Knowledge Booster


Learn more about
Need a deep-dive on the concept behind this application? Look no further. Learn more about this topic, statistics and related others by exploring similar questions and additional content below.Recommended textbooks for you
Linear Algebra: A Modern Introduction
Algebra
ISBN:
9781285463247
Author:
David Poole
Publisher:
Cengage Learning

Glencoe Algebra 1, Student Edition, 9780079039897…
Algebra
ISBN:
9780079039897
Author:
Carter
Publisher:
McGraw Hill
Linear Algebra: A Modern Introduction
Algebra
ISBN:
9781285463247
Author:
David Poole
Publisher:
Cengage Learning
Glencoe Algebra 1, Student Edition, 9780079039897…
Algebra
ISBN:
9780079039897
Author:
Carter
Publisher:
McGraw Hill