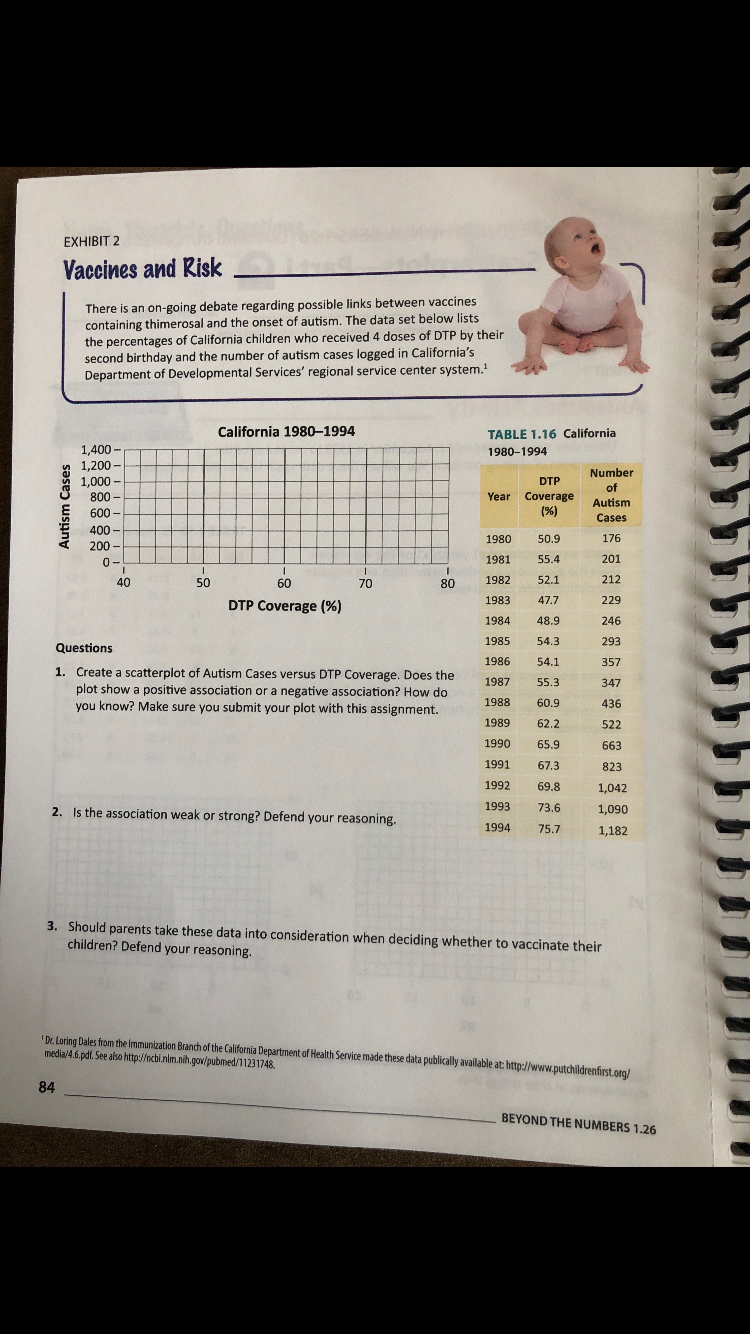
EXHIBIT 2 Vaccines and Risk There is an on-going debate regarding possible links between vaccines containing thimerosal and the onset of autism. The data set below lists the percentages of California children who received 4 doses of DTP by their second birthday and the number of autism cases logged in California's Department of Developmental Services' regional service center system. California 1980-1994 TABLE 1.16 California 1,400 1,200- 1980-1994 Number 1,000- 800 DTP of Year Coverage (%) Autism 600 Cases 400 50.9 176 1980 200- 201 1981 55.4 0- 1982 52.1 212 40 50 60 70 80 47.7 1983 229 DTP Coverage (%) 1984 48.9 246 1985 54.3 293 Questions 1986 54.1 357 1. Create a scatterplot of Autism Cases versus DTP Coverage. Does the plot show a positive association or a negative association? How do you know? Make sure you submit your plot with this assignment. 1987 55.3 347 1988 60.9 436 1989 62.2 522 1990 65.9 663 1991 67.3 823 1992 69.8 1,042 1993 73.6 1,090 Is the association weak or strong? Defend your reasoning. 2. 1994 75.7 1,182 3. Should parents take these data into consideration when deciding whether to vaccinate their children? Defend your reasoning. Dr. Loring Dales from the Immunization Branch of the California Department of Health Service made these data publically available at: http://www.putchildrenfirst.org/ media/4.6.pdf. See also http://ncbi.nlm.nih.gov/pubmed/11231748 84 BEYOND THE NUMBERS 1.26 Autism Cases
EXHIBIT 2 Vaccines and Risk There is an on-going debate regarding possible links between vaccines containing thimerosal and the onset of autism. The data set below lists the percentages of California children who received 4 doses of DTP by their second birthday and the number of autism cases logged in California's Department of Developmental Services' regional service center system. California 1980-1994 TABLE 1.16 California 1,400 1,200- 1980-1994 Number 1,000- 800 DTP of Year Coverage (%) Autism 600 Cases 400 50.9 176 1980 200- 201 1981 55.4 0- 1982 52.1 212 40 50 60 70 80 47.7 1983 229 DTP Coverage (%) 1984 48.9 246 1985 54.3 293 Questions 1986 54.1 357 1. Create a scatterplot of Autism Cases versus DTP Coverage. Does the plot show a positive association or a negative association? How do you know? Make sure you submit your plot with this assignment. 1987 55.3 347 1988 60.9 436 1989 62.2 522 1990 65.9 663 1991 67.3 823 1992 69.8 1,042 1993 73.6 1,090 Is the association weak or strong? Defend your reasoning. 2. 1994 75.7 1,182 3. Should parents take these data into consideration when deciding whether to vaccinate their children? Defend your reasoning. Dr. Loring Dales from the Immunization Branch of the California Department of Health Service made these data publically available at: http://www.putchildrenfirst.org/ media/4.6.pdf. See also http://ncbi.nlm.nih.gov/pubmed/11231748 84 BEYOND THE NUMBERS 1.26 Autism Cases

Glencoe Algebra 1, Student Edition, 9780079039897, 0079039898, 2018
18th Edition
ISBN:9780079039897
Author:Carter
Publisher:Carter
Chapter10: Statistics
Section10.6: Summarizing Categorical Data
Problem 23PPS

Related questions
Question
Need answers to questions 1, 2, and 3.
Transcribed Image Text:EXHIBIT 2
Vaccines and Risk
There is an on-going debate regarding possible links between vaccines
containing thimerosal and the onset of autism. The data set below lists
the percentages of California children who received 4 doses of DTP by their
second birthday and the number of autism cases logged in California's
Department of Developmental Services' regional service center system.
California 1980-1994
TABLE 1.16 California
1,400
1,200-
1980-1994
Number
1,000-
800
DTP
of
Year Coverage
(%)
Autism
600
Cases
400
50.9
176
1980
200-
201
1981
55.4
0-
1982
52.1
212
40
50
60
70
80
47.7
1983
229
DTP Coverage (%)
1984
48.9
246
1985
54.3
293
Questions
1986
54.1
357
1. Create a scatterplot of Autism Cases versus DTP Coverage. Does the
plot show a positive association or a negative association? How do
you know? Make sure you submit your plot with this assignment.
1987
55.3
347
1988
60.9
436
1989
62.2
522
1990
65.9
663
1991
67.3
823
1992
69.8
1,042
1993
73.6
1,090
Is the association weak or strong? Defend your reasoning.
2.
1994
75.7
1,182
3. Should parents take these data into consideration when deciding whether to vaccinate their
children? Defend your reasoning.
Dr. Loring Dales from the Immunization Branch of the California Department of Health Service made these data publically available at: http://www.putchildrenfirst.org/
media/4.6.pdf. See also http://ncbi.nlm.nih.gov/pubmed/11231748
84
BEYOND THE NUMBERS 1.26
Autism Cases
Expert Solution
This question has been solved!
Explore an expertly crafted, step-by-step solution for a thorough understanding of key concepts.

This is a popular solution!

Trending now
This is a popular solution!

Step by step
Solved in 4 steps with 1 images

Knowledge Booster


Learn more about
Need a deep-dive on the concept behind this application? Look no further. Learn more about this topic, statistics and related others by exploring similar questions and additional content below.Recommended textbooks for you
Glencoe Algebra 1, Student Edition, 9780079039897…
Algebra
ISBN:
9780079039897
Author:
Carter
Publisher:
McGraw Hill

Linear Algebra: A Modern Introduction
Algebra
ISBN:
9781285463247
Author:
David Poole
Publisher:
Cengage Learning

Big Ideas Math A Bridge To Success Algebra 1: Stu…
Algebra
ISBN:
9781680331141
Author:
HOUGHTON MIFFLIN HARCOURT
Publisher:
Houghton Mifflin Harcourt
Glencoe Algebra 1, Student Edition, 9780079039897…
Algebra
ISBN:
9780079039897
Author:
Carter
Publisher:
McGraw Hill
Linear Algebra: A Modern Introduction
Algebra
ISBN:
9781285463247
Author:
David Poole
Publisher:
Cengage Learning
Big Ideas Math A Bridge To Success Algebra 1: Stu…
Algebra
ISBN:
9781680331141
Author:
HOUGHTON MIFFLIN HARCOURT
Publisher:
Houghton Mifflin Harcourt