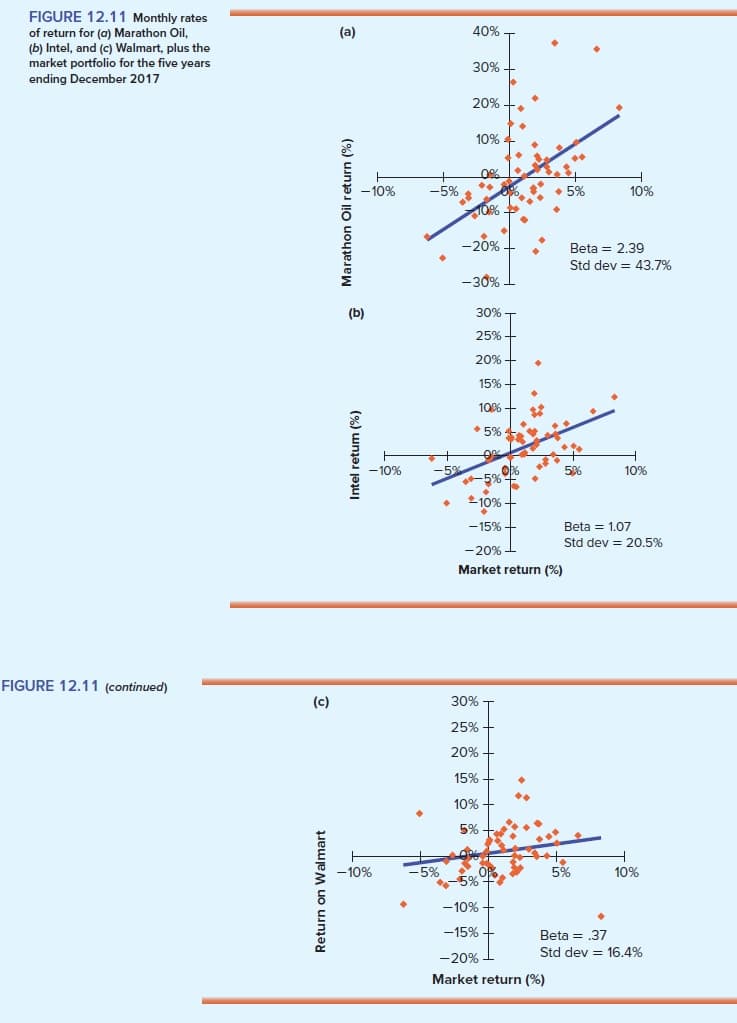
FIGURE 12.11 Monthly rates 40% of return for (a) Marathon Oil, (b) Intel, and (c) Walmart, plus the market portfolio for the five years (a) 30% ending December 2017 20% 10% 10% -10% -5% 5% -20% Beta 2.39 Std dev 43.7 % -30 % 30%-T (b) 25%+ 20%+ 15%- 10% 5% 506 -10% 10% -5% 5% 10% Beta 1.07 -15% Std dev 20.5% -20% Market return (%) FIGURE 12.11 (continued) 30% (c) 25% 20% 15% 10% 5% t. -5% Op 5% 5% -10% 10% -10% -15% Beta = 37 Std dev 16.4% -20 % Market return (%) Return on Walmart Marathon Oil return (%) Intel retum (%)


Risk and return
Before understanding the concept of Risk and Return in Financial Management, understanding the two-concept Risk and return individually is necessary.
Capital Asset Pricing Model
Capital asset pricing model, also known as CAPM, shows the relationship between the expected return of the investment and the market at risk. This concept is basically used particularly in the case of stocks or shares. It is also used across finance for pricing assets that have higher risk identity and for evaluating the expected returns for the assets given the risk of those assets and also the cost of capital.
Figure 12.11 shows plots of monthly
Required:
a. Which stock is safest for a diversified investor?
b. Which stock is safest for an undiversified investor who puts all her funds in one of these stocks?
c. Consider a portfolio with equal investments in each stock. What would this portfolio’s beta have been?
d. Consider a well-diversified portfolio made up of stocks with the same beta as Intel. What are the beta and standard deviation of this portfolio’s return? The standard deviation of the market portfolio’s return is 20%.
e. What is the expected rate of return on each stock? Use the


Trending now
This is a popular solution!

Step by step
Solved in 4 steps


