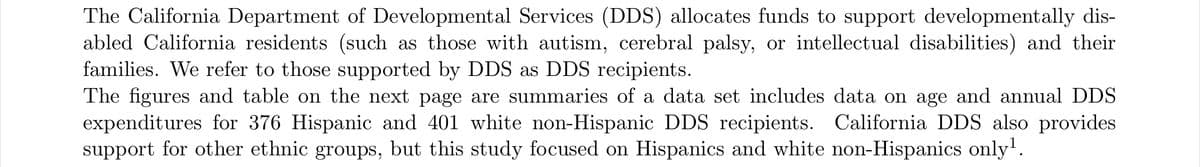
Figure I shows the age and annual DDS expenditures for 376 Hispanic and 401 white non hispanic DDS recipients. Based on the scatter plot, determine whether each of the following statements is TRUE or FALSE no explanaition is needed: Older DDS recipients generally had higher annual DDS expenditures The histogram of annual DDS expenditures would be unimodal. The median annual DDS expenditures of these DDS recipients would be higher than their mean annual DDS expenditures.


Inverse Normal Distribution
The method used for finding the corresponding z-critical value in a normal distribution using the known probability is said to be an inverse normal distribution. The inverse normal distribution is a continuous probability distribution with a family of two parameters.
Mean, Median, Mode
It is a descriptive summary of a data set. It can be defined by using some of the measures. The central tendencies do not provide information regarding individual data from the dataset. However, they give a summary of the data set. The central tendency or measure of central tendency is a central or typical value for a probability distribution.
Z-Scores
A z-score is a unit of measurement used in statistics to describe the position of a raw score in terms of its distance from the mean, measured with reference to standard deviation from the mean. Z-scores are useful in statistics because they allow comparison between two scores that belong to different normal distributions.
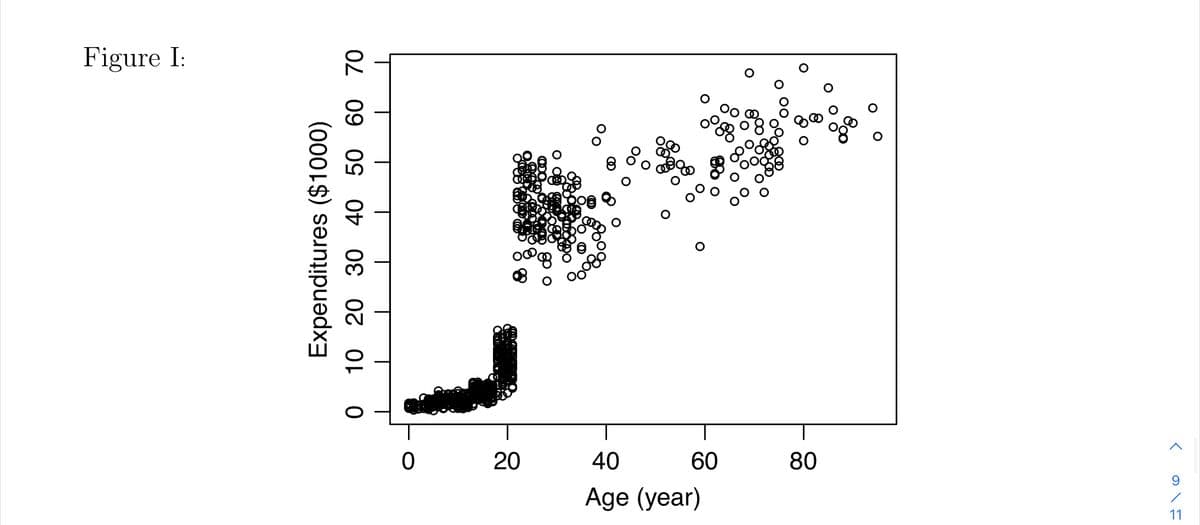
Figure I shows the age and annual DDS expenditures for 376 Hispanic and 401 white non hispanic DDS recipients. Based on the scatter plot, determine whether each of the following statements is TRUE or FALSE no explanaition is needed:
Older DDS recipients generally had higher annual DDS expenditures
The histogram of annual DDS expenditures would be unimodal.
The median annual DDS expenditures of these DDS recipients would be higher than their mean annual DDS expenditures.


Trending now
This is a popular solution!

Step by step
Solved in 4 steps


