Figure Z 430 220 100 40 16 Price 2 n Supply 20 Quantity Refer to Figure Z. When is this supply curve the most elastic? When price increases from $16 to $40. When price increases from $40 to $100. When price increases from $100 to $220. When price increases from $220 to $430.
Figure Z 430 220 100 40 16 Price 2 n Supply 20 Quantity Refer to Figure Z. When is this supply curve the most elastic? When price increases from $16 to $40. When price increases from $40 to $100. When price increases from $100 to $220. When price increases from $220 to $430.

Chapter6: Elasticities
Section: Chapter Questions
Problem 6P: Explain why using the midpoint formula for calculating the elasticity of demand gives the same...

Related questions
Question
Only typed answer
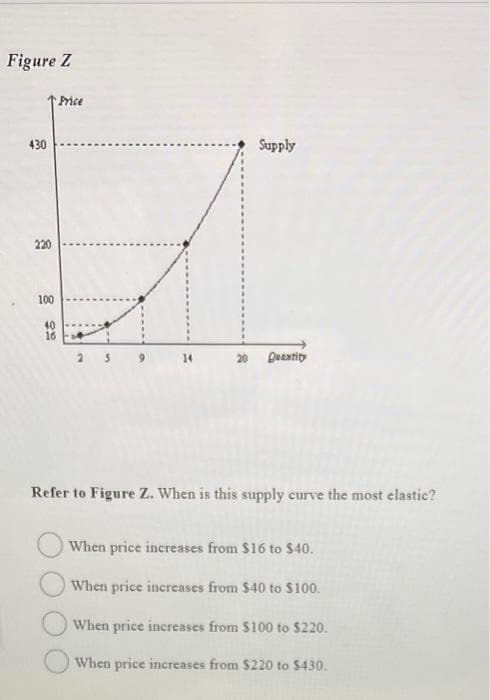
Transcribed Image Text:Figure Z
430
220
100
40
16
Price
2
n
Supply
20 Quantity
Refer to Figure Z. When is this supply curve the most elastic?
When price increases from $16 to $40.
When price increases from $40 to $100.
When price increases from $100 to $220.
When price increases from $220 to $430.
Expert Solution
This question has been solved!
Explore an expertly crafted, step-by-step solution for a thorough understanding of key concepts.

Step by step
Solved in 2 steps

Knowledge Booster


Learn more about
Need a deep-dive on the concept behind this application? Look no further. Learn more about this topic, economics and related others by exploring similar questions and additional content below.Recommended textbooks for you
Exploring Economics
Economics
ISBN:
9781544336329
Author:
Robert L. Sexton
Publisher:
SAGE Publications, Inc


Managerial Economics: Applications, Strategies an…
Economics
ISBN:
9781305506381
Author:
James R. McGuigan, R. Charles Moyer, Frederick H.deB. Harris
Publisher:
Cengage Learning
Exploring Economics
Economics
ISBN:
9781544336329
Author:
Robert L. Sexton
Publisher:
SAGE Publications, Inc
Managerial Economics: Applications, Strategies an…
Economics
ISBN:
9781305506381
Author:
James R. McGuigan, R. Charles Moyer, Frederick H.deB. Harris
Publisher:
Cengage Learning


