
Algebra & Trigonometry with Analytic Geometry
13th Edition
ISBN:9781133382119
Author:Swokowski
Publisher:Swokowski
Chapter4: Polynomial And Rational Functions
Section4.5: Rational Functions
Problem 8E

Related questions
Question
Fill out the chart using the following logarithmic function: y = log(-x-3)-2
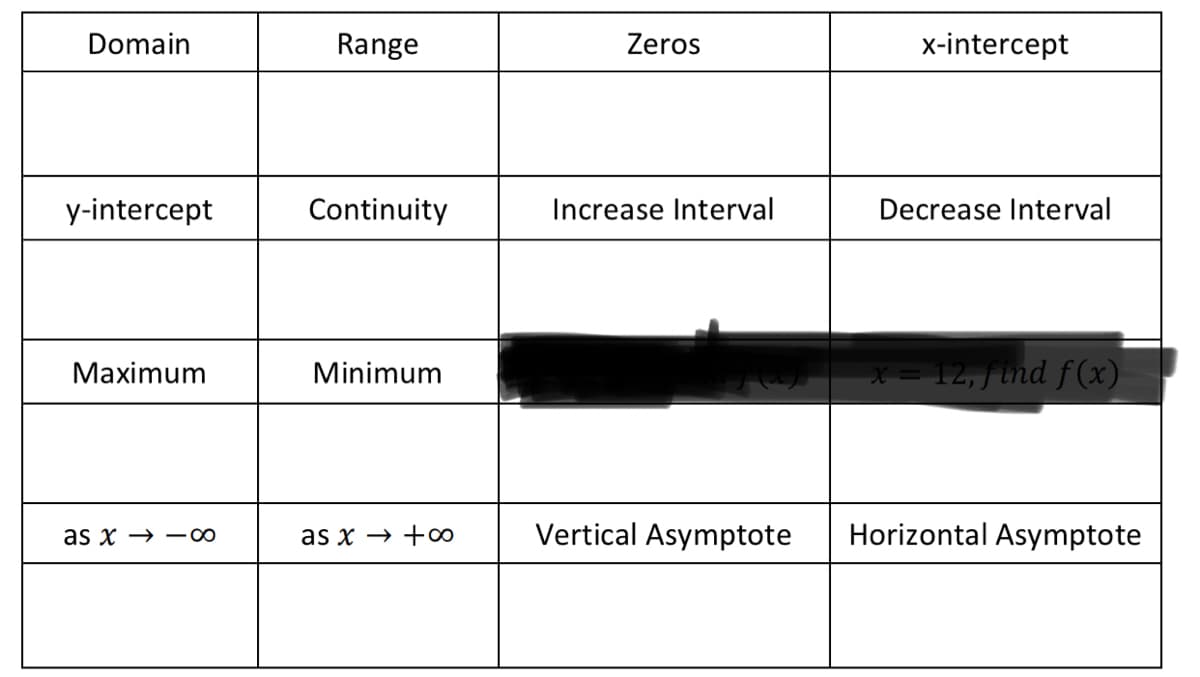
Transcribed Image Text:Domain
Range
Zeros
x-intercept
y-intercept
Continuity
Increase Interval
Decrease Interval
Maximum
x = 12,ftnd f(x)
Minimum
as x → - ∞
as x → +∞
Vertical Asymptote
Horizontal Asymptote
Expert Solution
This question has been solved!
Explore an expertly crafted, step-by-step solution for a thorough understanding of key concepts.

Step by step
Solved in 2 steps

Recommended textbooks for you
Algebra & Trigonometry with Analytic Geometry
Algebra
ISBN:
9781133382119
Author:
Swokowski
Publisher:
Cengage

Algebra & Trigonometry with Analytic Geometry
Algebra
ISBN:
9781133382119
Author:
Swokowski
Publisher:
Cengage