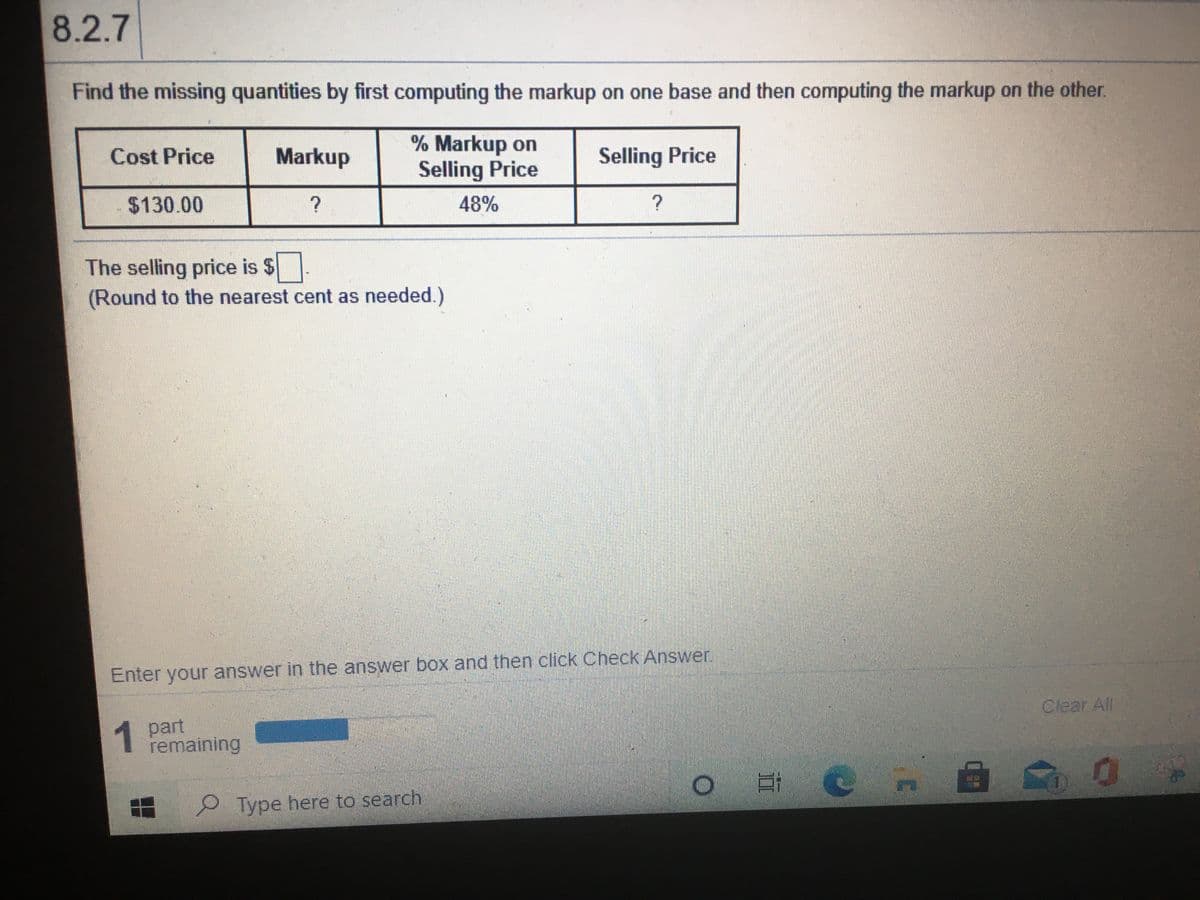
Find the missing quantities by first computing the markup on one base and then computing the markup on the other. % Markup on Selling Price Cost Price Markup Selling Price $130.00 48% ? The selling price is $. (Round to the nearest cent as needed.)


Q: e town of Marblehead, the market value of a home is $305,00O. The assessment rate is 40%. What is…
A:
Q: You plan to work for 40 years and then retire using a 25-year annuity. You want to arrange a retirem…
A:
Q: Find the amount on P15, 000 at 6 4 % simple interest for 15 months. O A. P15, 781.25 O B. P15,…
A: Recall: Formula, Amount, A=P(1+rt) We have, P=15,000, r=614%=254%=6.25%=6.25100=0.0625, t=15…
Q: A property that measures 6 hectares is for sale. a. How large is the property in acres? b. If the…
A:
Q: Use the formula for simple interest, I = Prt, to find the indicated quantity. 1 = $20; r = 4%; t = 3…
A: If P is the principal amount, r is the rate of interest and t is the time in years, then the…
Q: You deposit $500 each month into an account earning 5.8% interest. Round all answers to the nearest…
A: The solution is given by using formula for annuity as follows
Q: You deposit $5000 each year into an account earning 4.1% interest. How much will you have in the…
A: Please find the answer in next step.
Q: 4400 dollars is placed in an account with an annual interest rate of 8.25%. How much will be in the…
A: Given: Principal =$4400 Interest rate =8.25% =8.25100…
Q: a corporate bond paying $5000 after 36 weeks earns 0.05% simple interest per week. How much did it…
A: a corporate bond paying $5000 after 36 weeks earns 0.05% simple interest per week.
Q: A loan of $19,312 was repaid at the end of 15 months. What size repayment check (principal and…
A: Given : P = $19312 , t = 15 months , r = 11% = 0.11
Q: 9000 dollars is placed in an account with an annual interest rate of 8%. How much will be in the…
A:
Q: Find the present value of $14,500 in 8 months at 9.8% interest Give your answer to the nearest cent…
A:
Q: Jesse Garza has a home assessed at $390,000. The tax rate is 10.1 mills. What is the property tax on…
A: We have given that Jesse Garza home assessed =$390,000 Tax rate=10.1 mills Since we know that a…
Q: You want to purchase an automobile for $28,749.The dealer offers you 0% financing for 48 months or…
A:
Q: Convert the following decimal to fraction 1. 0.120 2. 4.50 3. 6.48 4. 0.78 5. 10.36
A:
Q: ompute the bill for quantities of 500, 1,200, and 2,500 gallons. (Round your answers to the nearest…
A:
Q: A charity organization is selling $4 raffle tickets as part of a fund raising program. They are…
A:
Q: How many times is the rate compounded? How much is the total in the account? (ROUND TO THE NEAREST…
A:
Q: The board members of a cooperative are planning to sell 1,250 tickets for a fund-raising project.…
A: Solution
Q: You want to purchase an automobile for $31,687. The dealer offers you 0% financing for months or a…
A:
Q: Using the information provided in the given table, determine how much monthly income would be…
A: Give estimated cost of local college next academic year is(for 9 months) 1. University Fees…
Q: A Chief Executive Officer of an investment firm receives a gross salary of $775,000 per annum. a.…
A: topic - periodic payment for different periods
Q: Use the formula for the amount, A = P(1 + rt), to find the indicated quantity. P = $5,100; r = 3.5%;…
A: Given query is to find the amount after t years.
Q: Find the missing numbers. Round rates to the nearest tenth of a percent and dollar amounts to the…
A:
Q: Employees at Winston's company get a 5% cost-of-living adjustment added to their salary each year.…
A:
Q: Find the amount at the end of the specified time. P = $30,000, r = 4%, t = 6 years, m = 4
A: The compounded amount is given by A=P1+rmmt where P is the principle, r is the rate of interest, m…
Q: You decide to contribute to a mutual fund that averages 3.3% return per year. If you contribute $22…
A: Given data, P = $225 r = 3.3 % per year = ( 3.3/4 ) % r = 0.00825
Q: You deposit $200 each month into an account earning 5.3% interest. Round all answers to the nearest…
A: Consider the given information. Money deposit, R= $190/ month Number of years, n=20·12=240 Interest…
Q: Chicora Inc. receives multiple discounts of 25/10/5 on cellphone that is listed $848.00, what is the…
A: Given listed price of cellphone is $848.00. Given discounts are 25% ,10% ,5%. Price after 1st…
Q: James has a mortgage of $94,500 at 8% for 30 years. The property taxes are $3,900 per year, and the…
A: To find the monthly payment
Q: 5.3% of what number is $2.28? Identify: - the percent (as a decimal) - the base (round to the…
A: 5.3% of what number is 2.28 ?
Q: A new car is purchased for 1700o dollars. The value of the car depreciates at 13.5% per year. What…
A:
Q: Find the principal. Round to the nearest cent. 32) Rate: 10% Time: 180 days Interest: $45.28
A:
Q: Suppose you want to have $300,000 for retirement in 25 years, Your account earns 7% interest. Round…
A: I have stated the used formula in the solution
Q: Use the formula for continous compunding interest to compute the balance in an account after 1,5,and…
A: please see the next step for solution
Q: Write the following repeating decimals as a fraction. a. 0.14 =
A: Since you have asked multiple questions in a single request, we would be answering only the first…
Q: Express the given fraction as a decimal and as a percentage. What is the decimal form of ?
A:
Q: You decide to contribute to a mutual fund that averages 5.1% return per year. If you contribute $575…
A: Consider a contribution made to a mutual fund which returns on an average of 5.1% per year. A…
Q: At your child's bir th, you begin contributing monthly to a college fund. The fund pays an APR of…
A: Given: Future value: $ 30,000 Interest rate: 4.6% Therefore: r=4.612% ∵ Compounded…
Q: The wholesale cost of a dining set is $1,500. The original markup was 59% based on selling price.…
A:
Q: Calculate the missing information. Round dollars to the nearest cent and percents to the nearest…
A: To fill the missing information
Q: Round the following amounts to the nearest cent: a. $30.878 b. $13.031 c. $50.99708
A:
Q: At age 20, someone sets up an IRA (individual retirement account) with an APR of 6%. At the end of…
A: Soled above problem.
Q: Calculate the missing information. Round dollars to the nearest cent and percents to the nearest…
A: The amount of markdown is $135 and the sale price $235.
Q: A corporate bond paying $5,000 after 18 weeks earns 0.05% simple interest per week. How much did it…
A:
Q: A manufacturer of skateboards offered a 7/5/2 chain discount to many customers. Bob’s Sporting Goods…
A:
Q: rade O P A Kami Uploads Alexandra Robin - Tax-markup wkst pdf 7. A pre-owned car costing $ 17,000,…
A:
Q: 10 I+10
A:
Q: age 25, someone sets up an IRA (individual retirement account) with an APR of 4%. At the end of…
A:
Q: Magkano ang nominal wage? Real wage = P10,200.00 CPI = P180.20
A: Given, Real wage = 10,200.00 CPI = 180.20

Equations and Inequations
Equations and inequalities describe the relationship between two mathematical expressions.
Linear Functions
A linear function can just be a constant, or it can be the constant multiplied with the variable like x or y. If the variables are of the form, x2, x1/2 or y2 it is not linear. The exponent over the variables should always be 1.


Trending now
This is a popular solution!

Step by step
Solved in 2 steps


- 10.1 Condé Nast Traveler conducts an annual survey in which readers rate their favorite cruise ship. All ships are rated on a 100-point scale, with higher values indicating better service. A sample of ships that carry fewer than 500 passengers and a sample of ships that carry 500 or more passengers is provided in the Microsoft Excel Online file below (Condé Nast Traveler, February 2008). Round your all answers to two decimal places. Smaller Ships Larger Ships 93.9 81 84.11 85.67 87.48 83.52 83.06 88.79 92.3 79.4 72.96 82.81 77.41 80.93 85.78 74.96 80.77 91.72 90.3 79.3 85.45 82.73 86.53 81.63 80.84 89.23 88.14 77.82 87.7 91.5 83.37 85.14 89.38 83.74 75.57 76.82 76.55 76.63 75.33 81.2 85.61 82.33 90.97 74.93 89.18 78.63 88.05 74.91 93.81 83.08 83.33 74.95 89.84 81.86 81.78 81.36 86.21 87.81 91.4 85.18 72.74 86.88 90.37 74.85 76.99 75.21 79.67 81.72 84.61 82.75 84.8 86.59 85.92 75.24 86.33 80.44…) Consider the following figures showing the situation of the Australian labourmarket in 2018 (figures are per thousand and in percentage).Employed persons ('000) 12 620.7Unemployed persons ('000) 711.9Unemployment rate (%) 5.4Participation rate (%) 65.6a. What is the labour force participation rate? Briefly checking some online sources is it lower or higherthan in other countries? Try to provide some explanation for the difference.b. Assume that the participation rate in Australia changes to 63%, but the adult population and the numberof employed remain unchanged (hint: if the adult population is not reported, you can calculate it easilyfrom the labour force and participation rate). What would be the labour force, the number ofunemployed, and the unemployment rate?c. Go to the latest LFS by the ABS at: www.abs.gov.au/ausstats/abs@.nsf/mf/6202.0. How does the currentsituation compare with 2018? Spend about 10 minutes going through the website and report at least oneobservation you find…The Fish and Game Department stocked a lake with fish in the following proportions: 30% catfish, 15% bass, 40% bluegill, and 15% pike. Five years later it sampled the lake to see if the distribution of fish had changed. It found that the 500 fish in the sample were distributed as follows. Catfish Bass Bluegill Pike 128 89 216 67 In the 5-year interval, did the distribution of fish change at the 0.05 level? (a) What is the level of significance? State the null and alternate hypotheses. H0: The distributions are the same. H1: The distributions are different.H0: The distributions are different. H1: The distributions are different. H0: The distributions are the same. H1: The distributions are the same.H0: The distributions are different. H1: The distributions are the same. (b) Find the value of the chi-square statistic for the sample. (Round your answer to three decimal places.) Are all the expected frequencies greater than 5? YesNo What sampling distribution…
- ***Only do this question using Minitab and be sure to show images and steps used*** Using Minitab and Interpreting Results cpafirm.csv (data for minitab): amount0.001.200.431.001.470.830.503.341.581.46-0.36-1.102.600.000.00-1.700.831.990.001.34 Medlin and Associates is a regional certified public accounting (CPA) firm located near Minneapolis. Recently, a team conducted an audit for a discount chain. One part of the audit involved developing anestimate for the mean dollar error in total charges that occurs during the checkout process. The firm wishes to develop a 95% confidence interval estimate for the population mean. The data cpaf irm.csvcan be read into Minitab. Note that positive values indicate that the customer was overcharged. Your statistics instructor claims that 60 percent of the students who take her Elementary Statistics class go through life feeling more enriched. For some reason that she can’t quite figure out, mostpeople don’t believe her. You decide to check this…A mining company finds that daily lost-work injuries average 1.2. If the local union contract has a clause requiring that the mine be shut down as soon as three workers incur lost-work injuries, on what percentage of the days will the mine be operational throughout the day?According to a 2006 survey conducted by the Center for Disease Control and Prevention (CDC), birth rates peak slightly between July and October each year. While a slight numerical increase in birth rates is often observed, this difference is assumed to be statistically non-significant. Thus, we would expect to see an equal number of people born during each month of the year in the United States. The "Birth Data.jasp" contains the birth months for 1380 babies (N = 1380) born during the year 2006 in the United States collected by the CDC. Conduct a Chi-Square Goodness of Fit Test at α = 0.05, to see if the number of babies born each month “fits” with the CDC’s assumptions about the population. Identify the correct alternative hypothesis A. H0: The number of babies born throughout the year is equal across all 12 months B. HA: The number of babies born in at least one month of the sample is equal to the number of babies born in at least one month of the population C. HA: The…
- According to a 2006 survey conducted by the Center for Disease Control and Prevention (CDC), birth rates peak slightly between July and October each year. While a slight numerical increase in birth rates is often observed, this difference is assumed to be statistically non-significant. Thus, we would expect to see an equal number of people born during each month of the year in the United States. The "Birth Data.jasp" contains the birth months for 1380 babies (N = 1380) born during the year 2006 in the United States collected by the CDC. Conduct a Chi-Square Goodness of Fit Test at α = 0.05, to see if the number of babies born each month “fits” with the CDC’s assumptions about the population. Identify the correct null hypothesis. A. H0: The number of babies born throughout the year is equal across all 12 months B. H0: The number of babies born during the summer months is greater than the number of babies born during the rest of the year C. HA: The number of babies born in…According to a 2006 survey conducted by the Center for Disease Control and Prevention (CDC), birth rates peak slightly between July and October each year. While a slight numerical increase in birth rates is often observed, this difference is assumed to be statistically non-significant. Thus, we would expect to see an equal number of people born during each month of the year in the United States. The "Birth Data.jasp" contains the birth months for 1380 babies (N = 1380) born during the year 2006 in the United States collected by the CDC. Conduct a Chi-Square Goodness of Fit Test at α = 0.05, to see if the number of babies born each month “fits” with the CDC’s assumptions about the population. What is the value of X2-crit? A. 5.72 B. 4.72 C. 19.68 D. 21.92According to a 2006 survey conducted by the Center for Disease Control and Prevention (CDC), birth rates peak slightly between July and October each year. While a slight numerical increase in birth rates is often observed, this difference is assumed to be statistically non-significant. Thus, we would expect to see an equal number of people born during each month of the year in the United States. The "Birth Data.jasp" contains the birth months for 1380 babies (N = 1380) born during the year 2006 in the United States collected by the CDC. Conduct a Chi-Square Goodness of Fit Test at α = 0.05, to see if the number of babies born each month “fits” with the CDC’s assumptions about the population. Identify the correct value for df. A. 5.72 B. 11 C. 107 D. 0.89
- 3. As part of the National Health and Nutrition Examination Survey, the Department of Health andHuman Services obtained self-reported heights and measured the heights for males aged 12-16. Allmeasurements are in inches. Is there a difference between the reported height vs. the measured height?Use a 0.05 level of significance.ReportedHeight68 71 63 71 71 60 65 64 54 63 66 72MeasuredHeight67.9 69.9 64.9 68.3 70.3 60.6 64.5 67.0 55.6 74.2 65.0 70.8DifferenceNull and alternative hypothesis (give both in symbolic form and sentence form):Test statistic and p-value (show the calculation or show what you entered into the calculator (screenshotsare ok here)):Technical conclusion, circle one: reject the null hypothesis or fail to reject the null hypothesisWhy did you choose to reject or fail to reject the null hypothesis?Nontechnical conclusion addressing the original claim:From 2007 to 2012, there was a substantial increase in obesity rates in the United States. The following information comes from an report on obesity: Results from a survey in 2007-2008, using measured heights and weights, indicate that an estimated 34.9% of U.S. adults aged 20 years and over are overweight, 32.4% are obese, and 8.7% are extremely obese. Use the information in the paragraph above to answer the following question: In 2007-2008, approximately out of 100 adults aged 20 years and older in the United States were obese. Round to the nearest adult.A report stated that based on observing a large number of vehicle occupants, the estimated percentage of drivers and passengers in a certain country who wear seatbelts is 83.2%. The report also gave information on seat belt use by sex and by whether the vehicle is traveling in an urban or rural area. The information in the following table is consistent with summary values given in the report. Urban Areas Rural Areas Male Female Male Female Seat belt 851 908 750 817 No Seat belt 149 92 250 183 Assume that these data are representative of drivers and passengers in the country. Consider the following conclusion. Females are more likely to wear seat belts than males in both urban and rural areas. The difference in the percentage of females and the percentage of males who wear seat belts is greater for rural areas than for urban areas. Provide a justification for this conclusion. Use the information in the table to calculate relevant probabilities. The differences in the proportions for…