Find the population variance and standard deviation. 8, 11, 15, 17, 19O

Glencoe Algebra 1, Student Edition, 9780079039897, 0079039898, 2018
18th Edition
ISBN:9780079039897
Author:Carter
Publisher:Carter
Chapter10: Statistics
Section10.4: Distributions Of Data
Problem 19PFA

Related questions
Topic Video
Question
100%
Please help me with the questions on attached document.
Thanks!
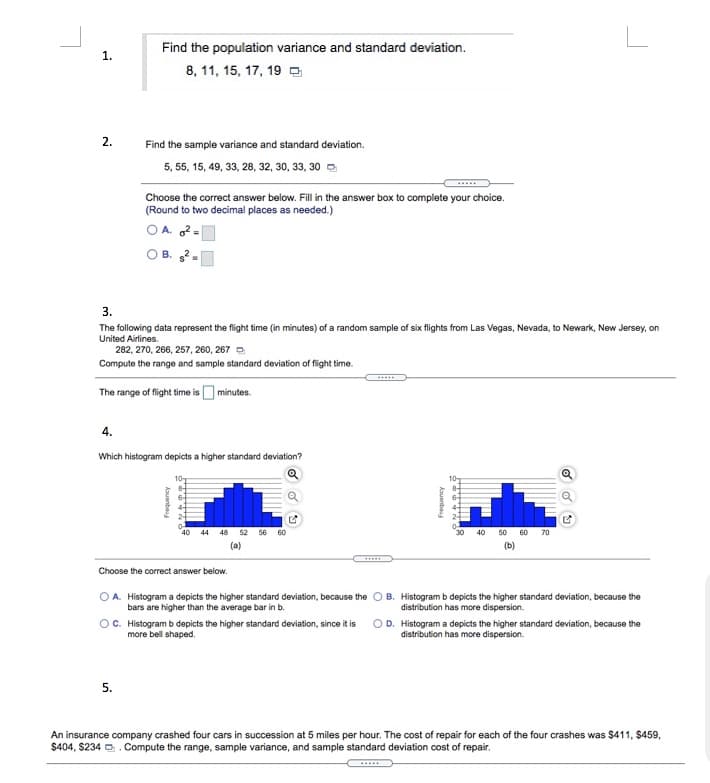
Transcribed Image Text:Find the population variance and standard deviation.
1.
8, 11, 15, 17, 19 O
2.
Find the sample variance and standard deviation.
5, 55, 15, 49, 33, 28, 32, 30, 33, 30 -
Choose the correct answer below. Fill in the answer box to complete your choice.
(Round to two decimal places as needed.)
O A. 2-
3.
The following data represent the flight time (in minutes) of a random sample of six flights from Las Vegas, Nevada, to Newark, New Jersey, on
United Airlines.
282, 270, 266, 257, 260, 267 O
Compute the range and sample standard deviation of flight time.
The range of flight time is Ominutes.
4.
Which histogram depicts a higher standard deviation?
107
40 44 48 52 56 60
40
50
60
70
(a)
Choose the correct answer below.
A. Histogram a depicts the higher standard deviation, because the
bars are higher than the average bar in b.
B. Histogram b depicts the higher standard deviation, because the
distribution has more dispersion.
OC. Histogram b depicts the higher standard deviation, since it is
more bell shaped.
OD. Histogram a depicts the higher standard deviation, because the
distribution has more dispersion.
5.
An insurance company crashed four cars in succession at 5 miles per hour. The cost of repair for each of the four crashes was $411, $459,
$404, $234 O. Compute the range, sample variance, and sample standard deviation cost of repair.
kouanbau
Frequency
Expert Solution
This question has been solved!
Explore an expertly crafted, step-by-step solution for a thorough understanding of key concepts.

This is a popular solution!

Trending now
This is a popular solution!

Step by step
Solved in 3 steps

Knowledge Booster


Learn more about
Need a deep-dive on the concept behind this application? Look no further. Learn more about this topic, statistics and related others by exploring similar questions and additional content below.Recommended textbooks for you
Glencoe Algebra 1, Student Edition, 9780079039897…
Algebra
ISBN:
9780079039897
Author:
Carter
Publisher:
McGraw Hill
Glencoe Algebra 1, Student Edition, 9780079039897…
Algebra
ISBN:
9780079039897
Author:
Carter
Publisher:
McGraw Hill