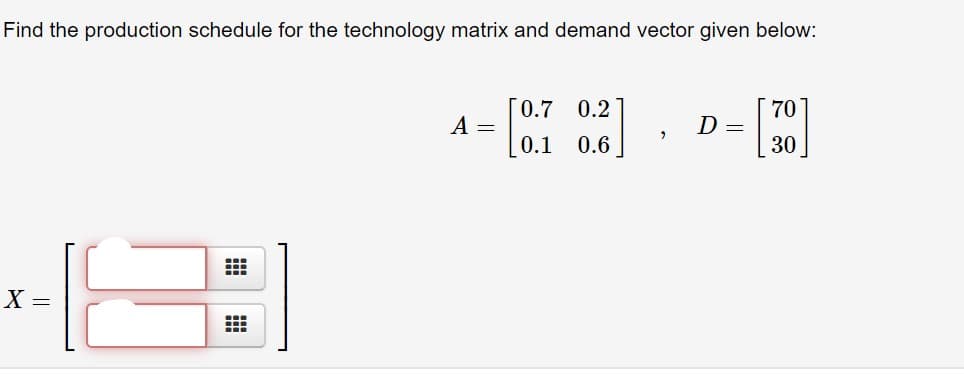
Find the production schedule for the technology matrix and demand vector given below: [0.7 0.2 70 A = 0.1 0.6 30


Q: Consider the system presented by the following transfer function
A:
Q: (a) Compute four-week and five-week moving averages for the time series. Week Time Series Value…
A: Answer:
Q: Q : A researcher specities the tollowing model ot human capital HC a t+a,RM +a2Y +a,HS +a SC +asEDH…
A: Human capital expenditure rises by 2010 units if the household receives remittances. Human capital…
Q: Given the following data for demand at the XYZ Company, calculate the monthly forecast for 2003…
A: Forecast are used to determine the future value over a period of time. Error in forecast can be…
Q: The table below contains price-demand and total cost data for the production of treadmills, where p…
A: Given Data : X Y = P($) 2910 1450 3415 1275 4645 1123 5330 918 Now, for calculating…
Q: Find the production schedule for the technology matrix and demand vector given below: 0.5 0.1 A = D…
A:
Q: How many kilograms of each food should Sofia buy each month to keep costs at a minimum?
A: Tabulation Protein Carbohydrates Fat Prize/kg in P Food A…
Q: Consider model y = B1+ B2 x2 + B3x3 + B4x4 + B5x5 + e Proof that SST=SSR+SSE for this model
A: SST is the sum of squared difference between the observed variable and its mean. It is called sum of…
Q: From the options given below choose the productivity of an Aluminium Fabrication process in terms of…
A: According to the given information, 480 window frame are made in 10 hours utilizing the resources:…
Q: Find the production schedule for the technology matrix and demand vector given below: 0.4 0.1 5 A =…
A: The given technology matrix is A=0.40.100.40.60.80.10.30.2 and demand vector is D=583. Let x=x1x2x3…
Q: Consider the data given in the table: 0.4 0.8 1.2 1.8 750 1000 1400 2000 2700 Use the data…
A: To fit an exponential curve y=CeAx we take natural logarithmic on both sides. It will give…
Q: Find the production schedule for the technology matrix and demand vector given below: 0.4 0.1 A =…
A: You should evaluate the production vector , using the following formula that relates the technology…
Q: Shan Foods estimated the following demand equation for its product using data from 26 supermarkets…
A: Since you have posted multiple questions, we will answer only some of them. Kindly mention…
Q: Determine the slope of the Age Dependency Ratio equation and explain the meaning of the slope in a…
A: It is given that the all 3 dependency ratio. The line equation for Age dependency ratio is y =1.43 x…
Q: The payoff table depicting revenues and is shown in the following table. payoffs (PV in millions)…
A: Since you have posted a question with multiple subparts, we will solve first three subparts for you.…
Q: A consumption matrix C and a demand vector d are given. In each case, find a feasible production…
A:
Q: Data collected on the yearly demand for 50-pound bags of fertilizer at Wallace Garden Supply are…
A: In statistics, a moving average is a calculation used to analyze data points by creating a series of…
Q: Cost Activity. OMR A. Space Cost 4564000 B. Labour Cost…
A:
Q: Answer the question on the basis of the following short run demand and cost data for a specific…
A: answer is in next step
Q: Find the production schedule for the technology matrix and demand vector given below: A= 0.1…
A:
Q: Consider the following data Age Class N 202 0.000 1 156 0.000 123 10.583 3 50 3.586 4 25 2.585 These…
A: lx: Proportion of original number of individuals surviving to the next stage or class; survivorship…
Q: Find the production schedule for the technology matrix and demand vector given below: 0.1 0.1 3 A =…
A:
Q: A coastal community needs to know the sustainable yield of grouper for its upcoming fishing season.…
A: To find : How many adult groupers can be sustainably caught during the fishing season in year 3. (a)…
Q: The Monthly demand for unit manufactured by the ABC Company has been as follows: Units 250 290 240…
A: Here, we are provided with a monthly data. Now, we know that, 4 weeks constitute of a month.…
Q: c) A week of performance data for another production line is given in Table Q6b. Assess and analyse…
A: We will use the basic knowledge of potential rates and performance analysis to answer this question…
Q: Obtain the appropriate measure of dispersion for age and both income variables. DATA Subject…
A: Standard deviation (SD) is the most commonly used measure of dispersion. It is a measure of spread…
Q: Shan Foods estimated the following demand equation for its product using data from 26 supermarkets…
A:
Q: Find the production schedule for the technology matrix and demand vector given below: [0.3 0.4 A =…
A:
Q: The distribution of daily demand for rental trucks at a vehicle rental company is shown in the…
A:
Q: Product 1 2 Process 1 10 in Process 2 6 20 Process 3 10 Unit Profit 20 30 minutes
A: The company operates for 10 hours a day and the manufacturing process is done in the three…
Q: Find the production schedule for the technology matrix and demand vector given below:
A: Given that A=0.10.20.31.40.41.50.400.2andD=357 to find the production schedule for given technology…
Q: то A B D Supply From | I 12 4 5 55 II 1 6 6 45 III 1 12 4 7 30 Demand 40 20 40 20
A: The transportation problem is considered as a special type of L.P.P whose adjectives is to determine…
Q: Find the production schedule for the technology matrix and demand vector given below: 0.2 0.6 4 A =…
A:
Q: A consumption matrix C and a demand vector d are given. In each case, find a feasible production…
A:
Q: 6. A mobile phone company offers a phone plan that allows 600 min of airtime per month. The revenue…
A:
Q: Determine the total demand x for industries 1, 2 and 3, given the matrix of technical coeffieicnts A…
A: We have to determine the total demand x of the industries using the matrix of technical coefficients…
Q: T 9. 11 12 data 13 14 15 16 7 8 10 Based on the boxplot above, what is the value for the minimum…
A: Solution : A box plot consist of Minimum, first quartile, median, third quartile and maximum.
Q: Table 2. Total oil production in millions of tons for Saudi Arabia from 1996-2013 Forecast Demand,…
A: The forecasting for the total oil production (in millions) is to be concluded using the simple…
Q: Find the production schedule for the technology matrix and demand vector given below: 0.2 A = 10.8…
A: Given that, Technology matrix isA=0.20.20.10.80.10.31.20.70.1and the demand vector isD=634881
Q: An input-output analysis of a national economy has the following input-output tableau. Agriculture…
A:
Q: (a) The Marino Company in Ventura County, southern California sells swimming pool equipment. The…
A: Note: Hey there! Thank you for the question. As you have posted a question with several sub-parts,…
Q: Material Unit Product A Product B Product C Steel Ton 5 4 Aluminum KG 50 40 60 Wood CFT 10 10 Glass…
A: Monthly demand for A , B and C is given . We will calculate the 6 month demand of products and then…
Q: From the data given below, find Marshall and edge worth's weighted aggregative ideal method:…
A: Solution: The given data is
Q: Find the production schedule for the technology matrix and demand vector given below: 0.4 1.7 3 A =…
A:
Q: 0.6 0.2 0.9 0.3 15 D = A = 14 X =
A:
Q: Find the production schedule for the technology matrix and demand vector given below: 0.1 0.3 0.4 A…
A:
Q: A D Wine Beer Champagne Whiskey Molding time 4 min. 9 min. 7 min. 10 min. Packaging time 1 min. 1…
A: This is the Linear Programming Problem: The given datas are, Wine Beer Champagne Whiskey…
Q: 89 july 223 Feb 57 august 286 mar 144 sept 212 april 221 oct 275 may 177 nov 188 june 280 dec 312 a)…
A: Month Demand Jan 89 Feb 57 mar 144 April 221 may 177 June 280 July 223 august 286…


Trending now
This is a popular solution!

Step by step
Solved in 2 steps with 2 images

- What is a carrying capacity? What kind of model has a carrying capacity built into its formula? Why does this make sense?Use this data and and generate a model of the annual maintenance expenses based on the age of the bug. If my bus is 4.1 years old, what are the projected annual maintenance costs? (Enter a whole number) Age of Bus (years) Annual Maintenance Cost ($) 2.4 350 2.3 370 2.4 480 3.1 520 3 590 5.8 550 4.8 750 3.8 800 3.6 790 4.9 950 5.5 915The price-demand and cost functions for the production of microwaves are given as
- Find the Consumers' and Producers' surplus at equilibrium for the market with the supply and demand functions below.The per capita consumption of breakfast cereal in the US has the following model that appears below...Use the basic equation for the capital asset pricing model (CAPM) to Find the risk-free rate for a firm with a required return of 15% and a beta of 1.25 when the market return is 14%
- For the demand function d(x) and demand level x, find the consumers' surplus.Using customer demand data, a company estimates it needs to produce items at a takt time of 38 seconds per item. Based on the operator loading chart shown (as is, without balancing), this process can meet takt time. True or FalseIs at least one of the two variables (weight and horsepower) significant in the model?
- Find the slope (ms) and the supply function thru the given supply curve.Apply the 3-years moving average method to forecast the required demand for the year 2021from the following historical data.Years 2012 2013 2014 2015 2016 2017 2018 2019 2020Demand 245 325 300 350 295 400 450 380 500Given the following data on the number of pints of ice cream sold at a local ice cream store for a 10-period time frame: Period Demand 2 MA Forecast Error square 2 MA= (De- Forecast)2 1 200 2 245 3 190 (200+245)/2=222.5 4 270 (245+190)/2=217.5 (270-217.5)2=2756.25 5 280 (190+270)/2=230 (280-230)2=2500 6 300 (270+280)/2=275 (300-275)2=625 7 320 (280+300)/2=290 (320-290)2=900 8 340 (300+320)/2=310 (340-310)2=900 9 320 (320+340)/2=330 (320-330)2=100 10 280 (340+320)/2=330 (280-330)2=2500 Use a 3-period moving average to forecast demand for period 11 Group of answer choices 326.7 313.3 246.7 300.0