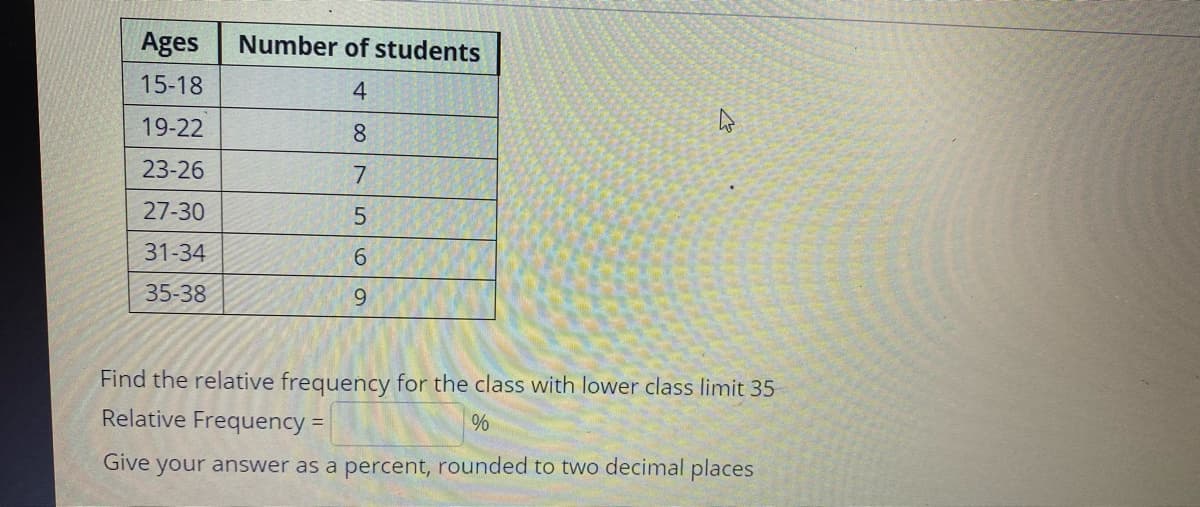
Find the relative frequency for the class with lower class limit 35 Relative Frequency =


Q: Label the diagram. Using the diagram what can you conclude about the approximate percentage of home…
A:
Q: A group of 100 students was surveyed about their interest in a new International Studies…
A: Given: Number of students with high interest (frequency with high interest) = 30 Total number of…
Q: A group of 100 students was surveyed about their interest in a new International Studies program.…
A: Relative Frequency Distribution: It is the ratio of the specified class frequency to the total…
Q: The figure below shows relative frequency histogram for 50 employees working in a small construction…
A: From the given histogram, Midpoint relative frequency 7.5 0.3 13.5 0.4 19.5 0.2 25.5 0.1…
Q: Find the number of students from the following who scored marks not more than 45. Marks range 30-40…
A: Given Information: Marks frequency 30-40 35 40-50 48 50-60 70 60-70 40 70-80 22…
Q: Calculate the relative frequency of the class interval (40 – 50].
A: b) Relative frequency interval for the class 40-50 = Frequency/Total (N) = 5/60 = 1/12 = 0.083…
Q: Define the term Homoscedasticity?
A: One of the assumptions of the Classical Linear Regression Model (CLRM) is homoscedasticity. It…
Q: How did you come to the conclusion for the relative frequencies numbers being 0.5, 0.10, etc?
A:
Q: Some students were asked about the amounts of their daily allowances, and their responses were…
A:
Q: what do you understand by frequency polygon?
A: A Frequency polygon is a graph constructed by using lines to join the midpoints of each interval, or…
Q: What is the difference between class boundaries and class limits
A: Class limit: The smallest and the largest value for a class are called as class limits. The smallest…
Q: Explain briefly why “Interval Estimates” are important to managers.
A: Definition of interval estimates : For given sample data to calculate the interval or range of…
Q: Create a table wherein it shows your score or your • class interval • class width • frequency •…
A: To create a table where a data is shown with the frequency, class interval and cumulative frequency.
Q: A frequency table of grades has five classes (A, B, C, D, F) with frequencies of 5, 11, 16, 7, and 2…
A:
Q: Blood glucose levels were recorded for all males over the age of 40, admitted with a diagnosis of…
A: Given data, lowest blood glucose level=58 highest blood glucose level= 442 Class interval=25 score…
Q: A “cut score” Determines who “makes the cut” Determines the proficiency of surgical success Is a…
A: In general words : Cut score : It is a selected point where particular test score is sufficient.…
Q: The absolute value for the difference between the two ladies z-score is
A: Let , X→N(μ=15.7 , σ=7.43) Since , the Rena's score on the exam is 9 and Sara's score was 25. We…
Q: In one sentence, describe the difference between relative and absolute measures of association.
A: we know that, Absolute measure of association gives better idea about public health impact. whereas…
Q: Between the 2010 Census and 2011 the official population of Denver increased from 600,158 to…
A: The formulas to calculate absolute change and relative change are given below.
Q: In order to be considered for a scholarship, Kyle must score at least in the 75 percentile of all…
A:
Q: Which can be classified as ordinal scale?
A: Ordinal level of measurement is used when there are categories which can be ordered.
Q: what is the difference between frequency and relative frequency?
A: To know the difference between frequency and relative frequency, we first need to know about…
Q: What is the relative frequency for the interval covered by the leftmost bar? Give your answer to 3…
A: The count (frequency) for leftmost bar is 8. The Total count (total frequency) is 8+4+1+6+12+9+12+12…
Q: Describe the relationship between the variables in terms of direction, form, strength and any…
A: The regression equation is given as y = 93.7342 – 0.033x.
Q: To guarantee that cans of soup are properly filled, some cans are sampled and the amounts measured.…
A:
Q: The following numbers are the exam scores taken from a Biology class: 98, 96, 79, 80, 76, 75, 99,…
A: From the given information, Sample data: {98, 96, 79, 80, 76, 75, 99, 59, 72, 88, 85, 72, 83, 74,…
Q: The line graph shows thefts per thousand vehicles in four countries between 1990 and 1999. Summarize…
A: In the question we have to summarize the details from the given data graph.
Q: What is Point Estimate?
A:
Q: Enter the exact answers (i.e. enter your answers for the relative and cumulative relative…
A: From the provided information, The table is as follow: Number of movies Frequency 0 3…
Q: A frequency table of grades has five classes (A, B, C, D, F) with frequencies of 2, 15, 18, 4, and 2…
A:
Q: represents the number of girls among 10 children. Use the range rule of thumb to determine whether 1…
A: here given , result from group of 10 BIRTHS from 10 different sets of parents x = number of girls…
Q: Calculate the range for the following variables assuming they are continuous 2,7,7,3,9,8,7,20
A: From the provided information, The data values are as follow: 2, 7, 7, 3, 9, 8, 7, 20
Q: What is Positive Relationship?
A:
Q: Calculate the range for the following variables, assumng they are continuous.…
A:
Q: What is a point estimate for μ?
A:
Q: The similarity between an ordinal level and an interval level is that.
A: Ordinal level of measurement: When the possible observations are tags or categories or names, with a…
Q: I need help understanding -upper class limit -lower class limit -class width -class boundaries
A:
Q: Explain why the relative frequency column of a frequency table might not sum to 1.0.
A:
Q: Is parameter proportion the same as statistical proportion. so lets say the statistical proportion…
A: it is given, statistical proportion =0.49
Q: Explain the three properties of interval estimates.
A: A interval estimate refers to the probability that a population parameter will fall between two set…
Q: Enter the exact answers (i.e. enter your answers for the relative and cumulative relative…
A: A frequency is the number of time a given data occurs in the given experiment, here the experiment…
Q: Select the correct choice that completes the sentence below. For a numerical variable, the sum of…
A:
Q: Consider an X^bar chart with control limits (3.2, 6.8,), find the upper limit of zone C.
A:
Q: The local amusement park was interested in the average wait time at their most popular roller…
A: Given Data: 54,118,118,119,120,124,130,140,161,180,181,191,199 The data is already arranged in…
Q: It's not for a grade. Stop rejecting it.
A: The number 'e' is defined as limh→0 eh-1h This could be verified by this graph clearly when h…
Q: What is the frequency of times the limit was exceeded by more than 2 items?
A: Here given , During one shift, the express lane clerk recorded how many times customers violated the…
Q: The figure below shows relative frequency histogram for 50 concrete cubes classified according to…
A: Let x be the data points or the class mid points, and f be the respective frequencies. Then,…


Trending now
This is a popular solution!

Step by step
Solved in 2 steps with 2 images


- The economic dynamism, which is the index of productive growth in dollars for countries that are designated by the World Bank as middle-income are in table #7.3.8 ("SOCR data 2008," 2013). Countries that are considered high-income have a mean economic dynamism of 60.29. Do the data show that the mean economic dynamism of middle-income countries is less than the mean for high-income countries? Test at the 5% level (Show the work) 25.8057 37.4511 51.915 43.6952 47.8506 43.7178 58.0767 41.1648 38.0793 37.7251 39.6553 42.0265 48.6159 43.8555 49.1361 61.9281 41.9543 44.9346 46.0521 48.3652 43.6252 50.9866 59.1724 39.6282 33.6074 21.6643Your hypothesis test for a proportion has a right-tailed critical region. The test statistic is zz = 1.84. Find the p-value accurate to 2 decimal places.Describe a continuous psychological variable and a population you would like to study. Given your example, describe the differences between the population, a single sample, and the sampling distribution for the psychological variable you have selected. What are some of the advantages of large random samples compared to small random samples? How would you use the central limit theorem in your example?
- How do you graph grade curves in StatCruch (finding two bounds within grades; ex. D, C, B)??? In other words, finding two cut off scores? Reference: The mean and standard deviation of last semester’s Test 1 scores are 76.5 and 14.8 respectively. Imagine we want to define letter grades using a Normal distribution (assuming this is appropriate). One possible grade distribution could be that the lowest 10% of students earn F’s, the next 15% earn D’s, the next 50% earn C’s, the next 15% earn B’s, and the rest of the students earn A’s. Using the Normal distribution, calculate the Test 1 scores that would separate these letter grades. Your answer needs to include five Normal graphs from StatCrunch where the shaded area on each graph shows the range of scores needed to earn the specific letter grade. Hint: The graphs for A and F will only have one value as a cutoff score whereas the graphs for a B, C, and D will have two cutoff scores. Which students are happy about their curved grades? Why?…Find the area of the shaded region. The graph to the right depicts IQ scores of adults, and those scores are normally distributed with a mean of 100 and a standard deviation of 15. A graph with a bell-shaped curve, divided into 3 regions by 2 lines from top to bottom, one on the left side and one on the right side. The region between the lines is shaded. Moving from left to right, the x-axis below the first line is labeled 75. The x-axis below the second line is labeled 110.similarity between the Weighted Mean value Theorem and Simpson’s rule
- The graph illustrates the distribution of test scores taken by College Algebra students. The maximum possible score on the test was 120, while the mean score was 72 and the standard deviation was 11. 395061728394105Distribution of Test Scores Use the "Empirical Rule", not a calculator or other technology. Do not round your answers. What is the approximate percentage of students who scored between 50 and 94 on the test?%What is the approximate percentage of students who scored between 61 and 72?%What is the approximate percentage students who scored between 61 and 83 on the test?%What is the approximate percentage of students who scored higher than 94 on the test?What does it mean by “upper bound” and “lower bound” of 95%? (empirical rule)Determine the mean number of points, x , earned on the test. Give your answer precise to one decimal place.
- A uniform distribution has a minimum of six and a maximum of ten. A sample of 50 is taken.Find the 70th percentile for the sums. (Round your answer to two decimal places.) How is the central limit theorem for sums z-score formula used to find the percentile?1. Find the area of the shaded region. The graph to the right depicts IQ scores of adults, and those scores are normally distributed with a mean of 100 and a standard deviation of 15. 75 A graph with a bell-shaped curve, divided into 2 regions by a vertical line. The vertical line extends from the bell curve to the x-axis, and is located on the left half, under the curve. The region on the left of this line is shaded. The x-axis below the vertical line is labeled 75. Question content area bottom The area of the shaded region is enter your response here (Round to four decimal places as needed.) 2. Find the area of the shaded region. The graph to the right depicts IQ scores of adults, and those scores are normally distributed with a mean of 100 and a standard deviation of 15. 83 A symmetric bell-shaped curve is plotted over a horizontal scale. A vertical line runs from the…Scores on a certain IQ test are approximately normally distributed with a mean of 100 and astandard deviation of 20 for a certain population of school children. For purposes of thisexercise, treat this distribution as continuous. Find the proportion of the population having ascore(a) less than 130,(b) between 110 and 130,(c) between 80 and 110,(d) less than 61 or greater than 139,(e) greater than 133.(f) Find the score which is the 90th percentile of this IQ distribution, that is, the score thathas 90% of the population below it.