First semester GPA for a random selection of freshman at a large university are shown. Estimate the true mean GPA of the freshman class with 99% confidence. Assume population standard deviation equals 0.62. 1.9, 3.2, 2.0, 2.9, 2.7, 3.3, 2.8, 3.0, 3.8, 2.7, 2.0, 1.9, 2.5, 2.7, 2.8, 3.2, 3.0, 3.8, 3.1, 2.7, 3.5, 3.8, 3.9, 2.7, 2.0, 2.8, 1.9, 4.0, 2.2, 2.8, 2.1, 2.4, 3.0, 3.4, 2.9, 2.
First semester GPA for a random selection of freshman at a large university are shown. Estimate the true mean GPA of the freshman class with 99% confidence. Assume population standard deviation equals 0.62. 1.9, 3.2, 2.0, 2.9, 2.7, 3.3, 2.8, 3.0, 3.8, 2.7, 2.0, 1.9, 2.5, 2.7, 2.8, 3.2, 3.0, 3.8, 3.1, 2.7, 3.5, 3.8, 3.9, 2.7, 2.0, 2.8, 1.9, 4.0, 2.2, 2.8, 2.1, 2.4, 3.0, 3.4, 2.9, 2.

Glencoe Algebra 1, Student Edition, 9780079039897, 0079039898, 2018
18th Edition
ISBN:9780079039897
Author:Carter
Publisher:Carter
Chapter10: Statistics
Section10.3: Measures Of Spread
Problem 1GP

Related questions

Question
100%
First semester GPA for a random selection of freshman at a large university are shown. Estimate the true mean GPA of the freshman class with 99% confidence. Assume population standard deviation equals 0.62.
1.9, 3.2, 2.0, 2.9, 2.7, 3.3, 2.8, 3.0, 3.8, 2.7, 2.0, 1.9, 2.5, 2.7, 2.8, 3.2, 3.0, 3.8, 3.1, 2.7, 3.5, 3.8, 3.9, 2.7, 2.0, 2.8, 1.9, 4.0, 2.2, 2.8, 2.1, 2.4, 3.0, 3.4, 2.9, 2.1
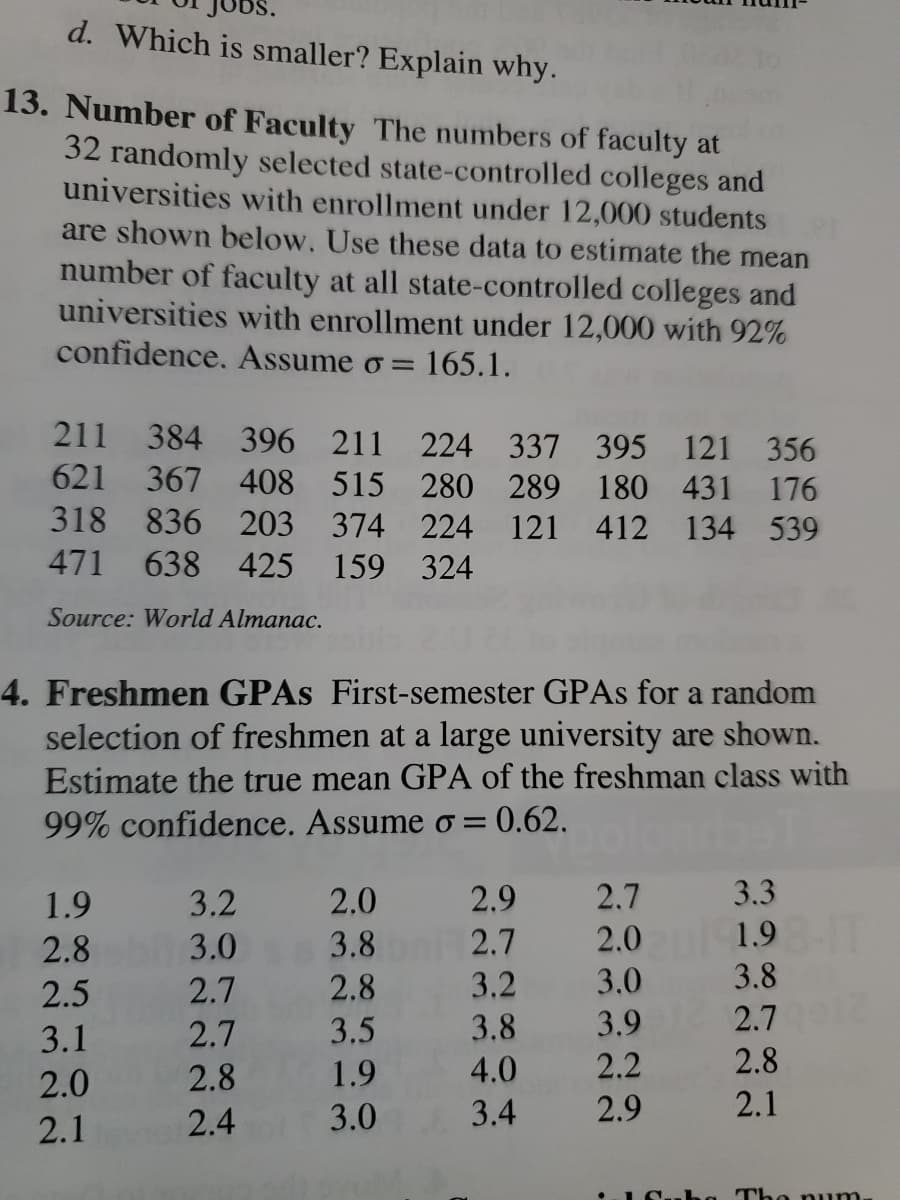
Transcribed Image Text:d. Which is smaller? Explain why.
13. Number of Faculty The numbers of faculty at
32 randomly selected state-controlled colleges and
universities with enrollment under 12,000 students
are shown below. Use these data to estimate the mean
number of faculty at all state-controlled colleges and
universities with enrollment under 12,000 with 92%
confidence. Assume o =
=165.1.
211 384 396 211 224 337 395 121 356
621 367 408 515 280 289 180 431 176
318 836 203 374 224 121 412 134 539
471
638 425 159 324
Source: World Almanac.
4. Freshmen GPAS First-semester GPAS for a random
selection of freshmen at a large university are shown.
Estimate the true mean GPA of the freshman class with
99% confidence. Assume o = 0.62.
3.3
3.2 2.0 2.9
2.7
1.9
2.7
2.8
3.0
3.8
2.0 1.9
3.0 3.8
2.7
3.2
2.7 2.8
3.5
2.5
3.1
2.7
3.8
3.9
2.8
1.9
4.0
2.2
2.8
2.0
2.1
2.4
3.0
3.4 2.9
2.1
The num.
Expert Solution
This question has been solved!
Explore an expertly crafted, step-by-step solution for a thorough understanding of key concepts.

This is a popular solution!

Trending now
This is a popular solution!

Step by step
Solved in 3 steps

Knowledge Booster


Learn more about
Need a deep-dive on the concept behind this application? Look no further. Learn more about this topic, statistics and related others by exploring similar questions and additional content below.Recommended textbooks for you
Glencoe Algebra 1, Student Edition, 9780079039897…
Algebra
ISBN:
9780079039897
Author:
Carter
Publisher:
McGraw Hill
Glencoe Algebra 1, Student Edition, 9780079039897…
Algebra
ISBN:
9780079039897
Author:
Carter
Publisher:
McGraw Hill