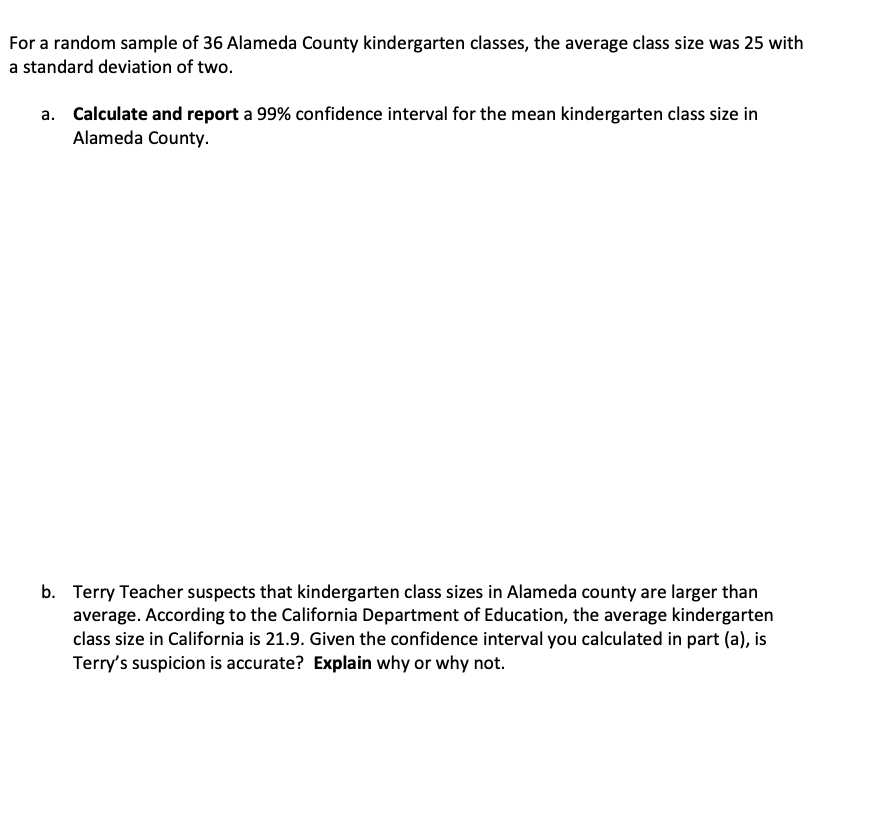
For a random sample of 36 Alameda County kindergarten classes, the average class size was 25 with a standard deviation of two. a. Calculate and report a 99% confidence interval for the mean kindergarten class size in Alameda County. b. Terry Teacher suspects that kindergarten class sizes in Alameda county are larger than average. According to the California Department of Education, the average kindergarten class size in California is 21.9. Given the confidence interval you calculated in part (a), is Terry's suspicion is accurate? Explain why or why not.
For a random sample of 36 Alameda County kindergarten classes, the average class size was 25 with a standard deviation of two. a. Calculate and report a 99% confidence interval for the mean kindergarten class size in Alameda County. b. Terry Teacher suspects that kindergarten class sizes in Alameda county are larger than average. According to the California Department of Education, the average kindergarten class size in California is 21.9. Given the confidence interval you calculated in part (a), is Terry's suspicion is accurate? Explain why or why not.

Glencoe Algebra 1, Student Edition, 9780079039897, 0079039898, 2018
18th Edition
ISBN:9780079039897
Author:Carter
Publisher:Carter
Chapter10: Statistics
Section10.4: Distributions Of Data
Problem 19PFA

Related questions

Question
Don't understand can you pleas show work and formula used. Thank you.
Transcribed Image Text:For a random sample of 36 Alameda County kindergarten classes, the average class size was 25 with
a standard deviation of two.
a. Calculate and report a 99% confidence interval for the mean kindergarten class size in
Alameda County.
b. Terry Teacher suspects that kindergarten class sizes in Alameda county are larger than
average. According to the California Department of Education, the average kindergarten
class size in California is 21.9. Given the confidence interval you calculated in part (a), is
Terry's suspicion is accurate? Explain why or why not.
Expert Solution
Step 1
a)
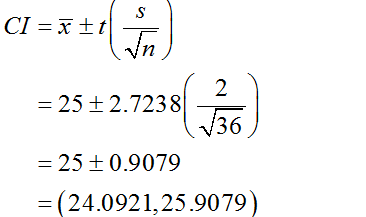
Since the population standard deviation is unknown, t distribution can be used for the computation of confidence interval.
Thus, sample mean = 25.
Sample standard deviation, s is 2.
The sample size, n is 36.
The degrees of freedom is 35(=36-1)
From the EXCEL, using the formula, =T.INV.2T (0.01, 35), the critical value is 2.7238.
The 99% confidence interval can be calculated as follows:

Trending now
This is a popular solution!

Step by step
Solved in 2 steps with 1 images

Knowledge Booster


Learn more about
Need a deep-dive on the concept behind this application? Look no further. Learn more about this topic, statistics and related others by exploring similar questions and additional content below.Recommended textbooks for you
Glencoe Algebra 1, Student Edition, 9780079039897…
Algebra
ISBN:
9780079039897
Author:
Carter
Publisher:
McGraw Hill
Glencoe Algebra 1, Student Edition, 9780079039897…
Algebra
ISBN:
9780079039897
Author:
Carter
Publisher:
McGraw Hill