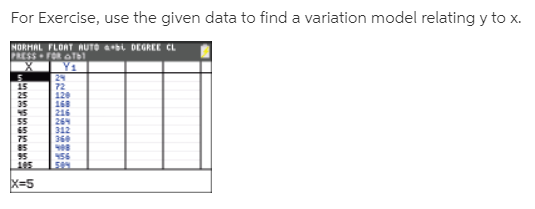
For Exercise, use the given data to find a variation model relating y to x. HORHAL FLORT RUTO bl DEGREE CL PRESS FOR aTb1 24 Y1 15 25 35 72 168 216 264 312 360 120 45 55 65 75 85 95 56 105 x=5


Q: Because elderly people may have difficulty standing to have their height measured, a study looked at…
A: Note: Hi there! Thank you for posting the question. As there are multiple sub parts, according to…
Q: 2. Fit a straight line to the following data and estimate the production in the year 1957. FIG. 01…
A: Calculate Fitting a straight line - Curve fitting using Least square method X Y 1951 10 1961…
Q: The following data shows the data between temperature and Power dissipation Construct the finite…
A:
Q: Find the equation of the multiple regression plane of Z on X and Y from the following data. X : 30…
A: Step-by-step procedure to find the multiple regression plane of Z on X and Y using Excel: In Excel…
Q: How much should a healthy Shetland pony weigh? Let x be the age of the pony (in months), and let y…
A:
Q: The accompanying table shows the cost C(x) (in dollars) of mailing a first-class letter weighing x…
A: Given:
Q: Fit a straight line to the following data and estimate the production in the year 1957. YEAR:…
A:
Q: Use the contour map in the figure below to calculate the average rate of change between the given…
A: B to A B & A are on the function with same c value. Hence, the average rate of change will be 0.…
Q: How much should a healthy Shetland pony weigh? Let x be the age of the pony (in months), and let y…
A: a) b) There is strong correlation between variable x and y There is positive correlation between…
Q: table shows the populations y (in millions) of the United States for 2009 through 2014. The variable…
A:
Q: of the difference of the proportions (upperclassmen - lowerclassmen) based his data? Select one:…
A:
Q: The following data represent the muzzle velocity (in feet per second) of rounds fired from a…
A: Given: n=6 α=0.01
Q: However, the rate of metal removal is also related to the hardness of the test specimen. Five c aken…
A:
Q: y 1 3.25 2 3.54 3 3.73 4 3.86 3.97
A: The least square regression technique uses a dataset to determine a function, y=f(x) such that the…
Q: The following data represent the muzzle velocity (in feet per second) of rounds fired from a 155-mm…
A: “Since you have posted a question with multiple sub-parts, we will solve first three subparts for…
Q: 5. Fit the following data in a linearly regressed line. Find the co-efficient of variation. x, cm 2…
A:
Q: Consider the following data. 21 6. 12 30 55 10.5 20.4 31.3 38.6 75.9 118.8 (a) Find a linear model.…
A: Given that the data are x 2 5 9 12 30 55 y 10.5 20.4 31.3 38.6 75.9…
Q: Use the second curve fitting criterion to minimize the sum of absolute deviations for the model y =…
A:
Q: . Use the following data to predict Monthly Rent Monthly Rent Size (Sq Ft) 825 1450 1250 850 1450…
A: a) The regression line is Y=60.94+1.14X.
Q: Q2/ The speed ,v meters per second ,of a car ,t seconds after it starts ,is shown in table 12 24 36…
A:
Q: The following data were collected to determine the relationship between pressure and the…
A: Find Regression line equations from the following data X Y 10 13 10 18 10 16 10 15 10…
Q: Find the average value of the function f (r) = T on the interval [1, 8]. 12 a) 12 b) 7 45 3 c) 4 d)…
A:
Q: consider the data sets below, determine if it is reasonable to assume that y is proportional to x.…
A: Two varying quantities are said to be in proportion if they are multiplicatively connected to a…
Q: Evaluate the coefficient of variation and coefficient of skewness for the data given below: MARKS 10…
A: The mean for the given data can be obtained as follows:
Q: 15 From the data given below find out the value of Y when X=35 10 20 30 40 Y 50 60 70 90 joL
A:
Q: The following data represent the muzzle velocity (in feet per second) of rounds fired from a 155-mm…
A: Given: Sr. No. A B 1 790.9 796.5 2 792.7 791.8 3 792.8 802.6 4 793.7 789.9 5 790.7…
Q: The following data represent the muzzle velocity (in feet per second) of rounds fired from a…
A: a.From the provided information, the two measurements (A and B) are taken on the same round.…
Q: The table shows the length, in km, of an Uber ride in New York City and the corresponc price, in…
A: Hello! As you have posted more than 3 sub parts, we are answering the first 3 sub-parts. In case…
Q: Is the magnitude of an earthquake related to the depth below the surface at which the quake occurs?…
A: a) Step-by-step software procedure to draw scatter plot using Excel software is given below:…
Q: The following data shows ages of musicians who performed at a concert. Age is a continuous variable.…
A: Given: Data of ages of musicians who performed at a concert. The data are: 22, 82 ,27 ,43 ,19 ,47…
Q: Find the regression line for the data below, given that r = 0.89, and predict the lumen when wattage…
A: It is an important part of statistics . It is widely used .
Q: 2- Given the function f (x,y, z) : x*y*+z°y_estimate the error and approximate percent relative…
A: Given that f(x, y, z)=x3y4+z3yz, x=1, y=2±0.2, z=1±0.3 we have to find…
Q: 4. Estimate the coefficients of the line y = ar+b such that the sum of the squared deviations…
A:
Q: The height of bedridden patients is often estimated from the length of the patient's ulna, the…
A: Solution
Q: Applying the method of group of averages, find a curve of the form y = ax +b _to the following data:…
A: We are given the curve : y=ax2+b According the question, when x=1 , then y=0.43…
Q: The data represent the heights in feet and the number of stories of the tallest buildings in a city.…
A: Introduction :- Here we have to find out the correlation coefficient between Heights and stories.…
Q: A pediatrician wants to determine the relation that may exist between a child's height and head…
A: In multiple linear regression, there will be more than one independent variable. In simple linear…
Q: Given the following information, describe the variation. 3 7 10 y 2 8 20 29 A Direct Variation…
A: Direct variation describes a simple relationship between two variables . We say y varies directly…
Q: Hello. How do you calculate this question on a TI-83? Thanks.
A: SolutionThe TI-83 does not give the standard error of the regression slope directly. The regression…
Q: A chemical company, wishing to study the effect of extraction time on the efficiency of an…
A:
Q: Use the given data to find the equation of the regression line. Examine the scatterplot and identify…
A: Given information: x y X^2 Y^2 XY 14 19.64 196 385.7296 274.96 8 15.5 64 240.25 124 10…
Q: The following data represent the muzzle velocity (in feet per second) of rounds fired from a…
A: Given: The muzzle velocity (in feet per second) of rounds fired from a 155-mm gun. x~N(μ,σ)…
Q: Use the given values of k and n to complete the table for the direct variation model y = kx". k = 3,…
A: Given, y= kxn k=3 n=2 For, x=2 ---> y= 3*2² = 12 x=4 ---> y= 3*4² = 48 x=6 ---> y= 3*6² =…
Q: The height of bedridden patients is often estimated from the length of the patient's ulna, the…
A: Solution
Q: The following data pertain to x, the amount of fertil-izer (in pounds) that a farmer applies to his…
A: Given data:
Q: 3. To estimate the surface area and volume of a wine bottle, the radius of the bottle is measured at…
A: NOTE: Hi! Thank you for your question. As per the honor code , we are allowed to answer the first…
Q: Applying the method of group of averages, find a curve of the form y= ax +b to the following data:…
A: We will answer the first question as we don't answer multiple question at a time. Please resubmit…
Q: The following data represent the muzzle velocity (in feet per second) of rounds fired from a…
A: (a) Reason why the data is matched-pairs data:The data shows that the muzzle velocity of rounds…
Q: The data below are the termperatures on randomly chosen days during a summer class and the number of…
A: Solution-: Let, X=Temperature and Y=Number of absences We have following table: X Y 72 3 85 7…

Step by step
Solved in 2 steps with 2 images

- You obtained the following raw data when setting up a Biuret standard curve: BSA (mg/ml) Absorbancy 540nm 0 0.158 1 0.210 2 0.260 3 0.305 4 0.360 5 0.410 6 0.455 7 0.510 8 0.530 9 0.550 10 0.554 What would the quality of the line-fit (R2 value) be if you do not exclude experimental outliers? (Give you answer to 4 decimal places)"given a simple regression with slope b=3, s (sub y)=8, and s (sub x)= 2, and n=30. Find the standard error of the estimate."The results of an independent-measures research study are reported as “t(22) = 2.12, p < .05, two tails.” For this study, what t values formed the boundaries for the critical region? a. ±2.080 c. ±2.069 b. ±2.074 d. ±2.064
- The results of an independent-measures research study are reported as "t(20) = 2.12, p < .05, two tails." For this study, what t values formed the boundaries for the critical region?Refer to Exercise 16. Assume that T0 = 73.1 ± 0.1°F, Ta = 37.5 ± 0.2°F, k = 0.032 min−1 with negligible uncertainty, and T = 50°F exactly. Estimate t, and find the relative uncertainty in the estimate.calculate the average over the given interval. f (s) = s −2, [2, 5]
- The table below list weights (carats) and prices (dollars) of randomly selected diamonds Weight 0.3 0.4 0.5 0.5 1.0 0.7 Price 510 1151 1343 1410 5669 2277 Find r Test with a .05 level of significance H0 : ρ = 0 and H1: : ρ ≠ 0 Find m and b for simple regressionHere is a bivariate data set.xy182425915011737106295223812246 Find the correlation coefficient and report it accurate to four decimal places. r =The data below shows the maximum temperature (oC) and the number of bowls of soup sold at God’s Grace Canteen on eleven randomly selected days last year. Day 1 2 3 4 5 6 7 8 9 10 11 Temp. (oC) 32 36 22 29 25 18 11 16 8 5 2 Bowls Sold 2 2 10 10 20 35 45 50 50 57 63 On graph paper, draw a scatter plotoftemperature against bowls soldto represent the data using a scale of 1 cm to represent 5 bowls and 2cm to represent 5oC. Writedown the type of relationship between the variables. Calculatethe mean number of bowls of soup, , sold. Findthe mean maximum temperature, of soup recorded. Plot and label the point M(, ) on your graph. Theline of best fit for the data passes through the point M and the y-intercept (0, 33.2). Draw this line on your graph. Find the equation of the line of best fit. On another day of the year, the temperature was 20o Using the equationof the line of best fit,estimate the…
- Refer to Exercise 7. Assume that p = 4.3 ± 0.1 cm and q = 2.1 ± 0.2 cm. Estimate f, and find the relative uncertainty in the estimate.The following data represent the muzzle velocity (in feet per second) of rounds fired from a 155-mm gun. For each round, two measurements of the velocity were recorded using two different measuring devices, resulting in the following data. Complete parts (a) through (d) below. Observation 1 2 3 4 5 6 A 790.2 793.3 791.6 793.9 794.7 793.1 B 794.8 789.0 796.2 793.5 802.9 791.3 (a) Why are these matched-pairs data? A. All the measurements came from rounds fired from the same gun. B. Two measurements (A and B) are taken on the same round. C. The measurements (A and B) are taken by the same instrument. D. The same round was fired in every trial. (b) Is there a difference in the measurement of the muzzle velocity between device A and device B at the α=0.01level of significance? Note: A normal probability plot and boxplot of the data indicate that the differences are…The following data pertain to x, the amount of fertil-izer (in pounds) that a farmer applies to his soil, and y, his yield of wheat (in bushels per acre): xy xy xy112 33 88 24 37 2792 28 44 17 23 972 38 132 36 77 3266 17 23 14 142 38112 35 57 25 37 1388 31 111 40 127 2342 8 69 29 88 31126 37 19 12 48 3772 32 103 27 61 2552 20 141 40 71 1428 17 77 26 113 26 Assuming that the data can be looked upon as a randomsample from a bivariate normal population, calculate rand test its significance at the 0.01 level of significance.Also, draw a scattergram of these paired data and judgewhether the assumption seems reasonable.
