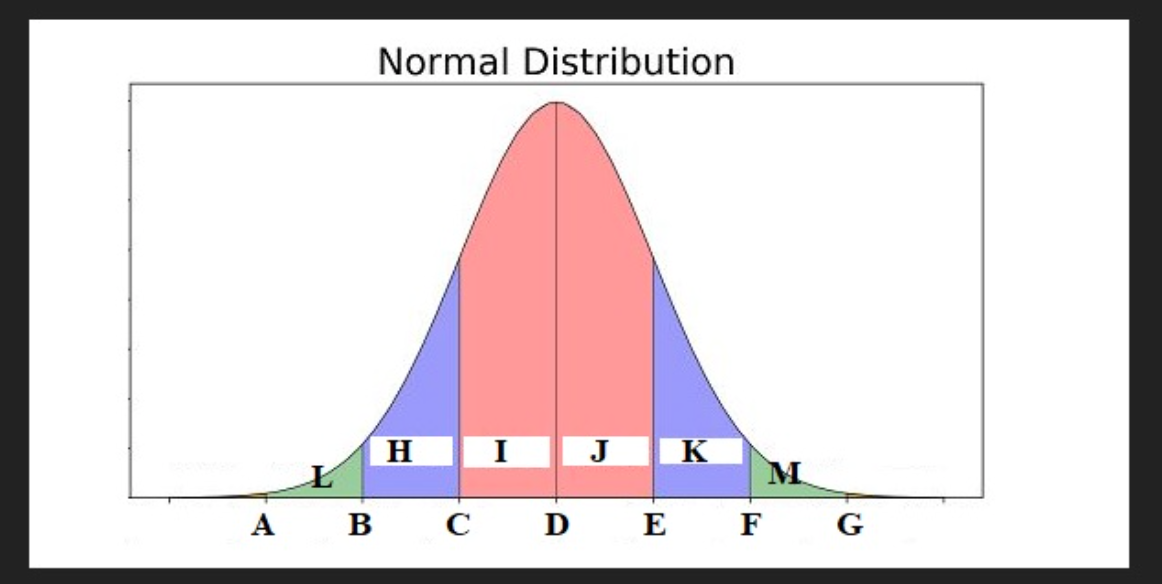
For males in their 30s, the distribution of cholesterol readings, in mg/dl, is normally distributed with a mean of 210 and a standard deviation of 15. Using this sketch of the normal distribution, supply the labels for the missing values that correspond to the distribution of cholesterol readings for males in their 30s. Give the numerical value for each of the lettered positions on the number line: A B C E F G For the next set of items,use the Empirical Rule in calculating your answers. Round all values to the nearest whole percent and give your answer with a % sign (e.g., 27%). What percentage of cholesterol readings would fall in region J of the graph? What percentage of cholesterol readings would fall in region L of the graph? What percentage of cholesterol readings would be less than D? What percentage of cholesterol readings would fall in the combined regions between B and F (i.e., H+I+J+K)?


For males in their 30s, the distribution of cholesterol readings, in mg/dl, is
Using this sketch of the normal distribution, supply the labels for the missing values that correspond to the distribution of cholesterol readings for males in their 30s.
Give the numerical value for each of the lettered positions on the number line:
A B C
E F G
For the next set of items,use the
What percentage of cholesterol readings would fall in region J of the graph?
What percentage of cholesterol readings would fall in region L of the graph?
What percentage of cholesterol readings would be less than D?
What percentage of cholesterol readings would fall in the combined regions between B and F (i.e., H+I+J+K)?
If the data follows normal distribution, then
1. 68% of observations lie between mean ± 1 SD,
2. 95% of observations lie between mean ± 2 SD,
3. 99.7% of observations lie between mean ± 3 SD.
Here, mean = 210 and SD = 15.

Step by step
Solved in 2 steps


