For the following frequency distribution, how many individual scores are in the entire set? f 4 3 1 2 3 ON= 54 ON = 10 ON= 14 O impossible to determine 4,
For the following frequency distribution, how many individual scores are in the entire set? f 4 3 1 2 3 ON= 54 ON = 10 ON= 14 O impossible to determine 4,

Glencoe Algebra 1, Student Edition, 9780079039897, 0079039898, 2018
18th Edition
ISBN:9780079039897
Author:Carter
Publisher:Carter
Chapter10: Statistics
Section10.6: Summarizing Categorical Data
Problem 4AGP

Related questions
Question
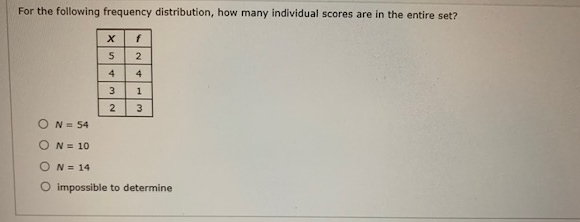
Transcribed Image Text:For the following frequency distribution, how many individual scores are in the entire set?
f
4
3
1
2
3
ON= 54
ON = 10
ON= 14
O impossible to determine
4,
Expert Solution
This question has been solved!
Explore an expertly crafted, step-by-step solution for a thorough understanding of key concepts.

This is a popular solution!

Trending now
This is a popular solution!

Step by step
Solved in 2 steps

Recommended textbooks for you
Glencoe Algebra 1, Student Edition, 9780079039897…
Algebra
ISBN:
9780079039897
Author:
Carter
Publisher:
McGraw Hill
Glencoe Algebra 1, Student Edition, 9780079039897…
Algebra
ISBN:
9780079039897
Author:
Carter
Publisher:
McGraw Hill