A First Course in Probability (10th Edition)
10th Edition
ISBN: 9780134753119
Author: Sheldon Ross
Publisher: PEARSON
expand_more
expand_more
format_list_bulleted
Concept explainers
Question

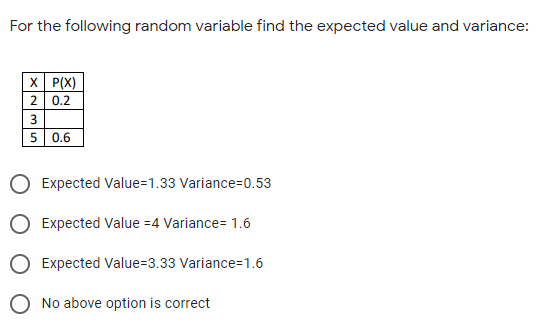
Transcribed Image Text:For the following random variable find the expected value and variance:
X P(X)
2 0.2
3
5 0.6
O Expected Value=1.33 Variance=0.53
O Expected Value =4 Variance= 1.6
O Expected Value=3.33 Variance=1.6
O No above option is correct
Expert Solution

This question has been solved!
Explore an expertly crafted, step-by-step solution for a thorough understanding of key concepts.
This is a popular solution
Trending nowThis is a popular solution!
Step by stepSolved in 2 steps with 2 images

Knowledge Booster
Learn more about
Need a deep-dive on the concept behind this application? Look no further. Learn more about this topic, probability and related others by exploring similar questions and additional content below.Similar questions
- * Let X is a Gaussian random variable with zero mean an variance o. Y = X. Find mean of Random Variable Y.arrow_forwardAn electronic company's records show that the mean number of circuit.boards rejected per batch is 5.7 with a variance of 1.4. Due to a change in the molding process, factory management has hired you to perform a hypothesis test to check if the variance, o, has increased. To do so, you test a random sample of 10 batches produced using the new process; the number of circuit boards rejected per batch has a sample variance of 2.5. Under the assumption that the number of circuit boards rejected per batch using the new process follows a normal distribution, you will perform a chi-square test. Find x, the value of the test statistic for your chi-square test. Round your answer to three or more decimal places. * = 0arrow_forwardYou are testing the claim that having lights on at night increases weight gain (abstract). A sample of 10 mice lived in an environment with bright light on all of the time and 8 mice who lived in an environment with a normal light/dark cycle is given below. Test the claim using a 10% level of significance. Assume the population variances are unequal and that the weight changes are normally distributed. Give answers to 3 decimal places. Data available at StatKey, choose Mice Wgt Gain-2e data set Light (x₁) 1.71 4.67 4.99 5.33 5.43 6.94 7.15 9.17 10.26 11.67 What are the correct hypotheses? Note this may view better in full screen mode. Select the correct symbols in the order they appear in the problem. Ho: Select an answer ? V Select an answer V Ha: Select an answer ✓ Based on the hypotheses, find the following: Test Statistic = Dark (₂) 2.27 2.53 2.83 4 4.21 4.6 5.95 6.52 p-value = ? V Select an answer V (Hint: difference in means from Ha) The correct decision is to Select an answer…arrow_forward
- Assume that you have a binomial experiment with p= .3 and a sample size of a 100. The value of the variance is?arrow_forwardWhich of the following factors have each of the advantages listed when using analysis of variance? Multiple answers can be chosen. 1. Makes ANOVA more robust to departures from the assumption of normality. 2. Makes ANOVA more robust to departures from the assumption of equal variance. 3. Increases the power of the test. Options: Large sample size. Balanced design.arrow_forwardA researcher wants to measure average cardiovascular health of university students and compare those scores to the average scores in the general population. Assuming that population variance is known, what statistical test is most appropriate for this study? independent-samples t-test single-sample t-test z-test for sample mean related-samples t-testarrow_forward
- You are testing the claim that having lights on at night increases weight gain (abstract). A sample of 10 mice lived in an environment with bright light on all of the time and 8 mice who lived in an environment with a normal light/dark cycle is given below. Test the claim using a 2% level of significance. Assume the population variances are unequal and that the weight changes are normally distributed. Give answers to 3 decimal places. Data available at StatKey, choose Mice Wgt Gain-2e data set Light (1) 1.71 4.67 4.99 5.33 5.43 6.94 7.15 9.17 10.26 11.67 What are the correct hypotheses? Note this may view better in full screen mode. Select the correct symbols in the order they appear in the problem. Ho: ₁ Test Statistic = Dark (₂) 2.27 2.53 2.83 4 4.21 4.6 5.95 6.52 Ha: ₁ Based on the hypotheses, find the following: p-value = = V Select an answer ✓ Select an answer (Hint: difference in means from H₂) The correct decision is to fail to reject the null hypothesis The correct summary…arrow_forwardAt a 0.05, test to see if the population variances from which the following samples were drawn are equal. The test statistic is Group 1 n₁ = 21 Group 2 n₂ = 19 $1 = 20 S2 = 18 (A) 1.56 (B) 1.23 (C) 1.26 (D) 1.11arrow_forward
arrow_back_ios
arrow_forward_ios
Recommended textbooks for you
- A First Course in Probability (10th Edition)ProbabilityISBN:9780134753119Author:Sheldon RossPublisher:PEARSON

A First Course in Probability (10th Edition)
Probability
ISBN:9780134753119
Author:Sheldon Ross
Publisher:PEARSON