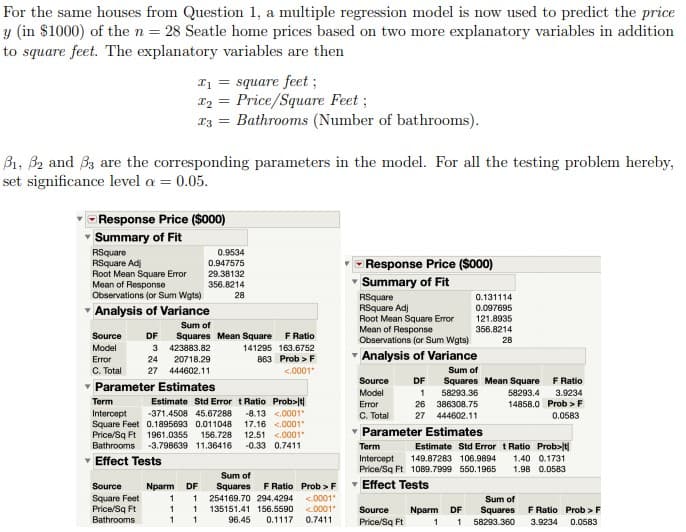
For the same houses from Question 1, a multiple regression model is now used to predict the price y (in $1000) of the n = 28 Seatle home prices based on two more explanatory variables in addition to square feet. The explanatory variables are then I1 = square feet; Price/Square Feet ; Bathrooms (Number of bathrooms). I2 = Bi, B2 and 33 are the corresponding parameters in the model. For all the testing problem hereby, set significance level a = 0.05. Response Price ($000) Summary of Fit RSquare RSquare Adj Root Mean Square Error Mean of Response Observations (or Sum Wgts) 0.9534 - Response Price (So00) 0.947575 29.38132 356.8214 Summary of Fit 28 RSquare RSquare Adj Root Mean Square Error Mean of Response Observations (or Sum Wgts) 0.131114 - Analysis of Variance 0.097695 121.8935 Sum of Squares Mean Square 3 423883.82 356.8214 Source DF F Ratio 28 Model 141295 163.6752 863 Prob > F Analysis of Variance Error 24 20718.29 C. Total - Parameter Estimates 27 444602.11 <.0001 Sum of Source DF F Ratio Squares Mean Square 58293.36 Model 58293.4 3.9234 Estimate Std Error tRatio Prob>lt| -8.13 <.0001 17.16 <.0001 12,51 <.0001 Term Error 26 386308.75 14858.0 Prob >F Intercept Square Feet 0.1895693 0.011048 Price/Sq Ft 1961.0355 156.728 Bathrooms -371.4508 45.67288 C. Total 27 444602.11 0.0583 Parameter Estimates -3.798639 11.36416 -0.33 0.7411 Term Estimate Std Error t Ratio Prob>t| 1.40 0.1731 1.98 0.0583 v Effect Tests Intercept Price/Sq Ft 1089.7999 550.1965 149.87283 106.9894 Sum of F Ratio Prob >F Effect Tests Source Nparm DF Squares Square Feet Price/Sq Ft Bathrooms 254169.70 294.4294 <.0001" <.0001" Sum of 135151.41 156.5590 Source Nparm DF Squares F Ratio Prob >F 96.45 0.1117 0.7411 Price/Sq Ft 58293.360 3.9234 0.0583


Correlation
Correlation defines a relationship between two independent variables. It tells the degree to which variables move in relation to each other. When two sets of data are related to each other, there is a correlation between them.
Linear Correlation
A correlation is used to determine the relationships between numerical and categorical variables. In other words, it is an indicator of how things are connected to one another. The correlation analysis is the study of how variables are related.
Regression Analysis
Regression analysis is a statistical method in which it estimates the relationship between a dependent variable and one or more independent variable. In simple terms dependent variable is called as outcome variable and independent variable is called as predictors. Regression analysis is one of the methods to find the trends in data. The independent variable used in Regression analysis is named Predictor variable. It offers data of an associated dependent variable regarding a particular outcome.
See the attached image for the introduction.
Is there evidence that Square Feet(x1), Price/Square Feet(x2), and Bathrooms(x3) together provide important information for predicting price? In terms of variables xi and parameters βi, write the null and alternative hypotheses. Find the statistics and its corresponding p-value.
State your conclusion.


Trending now
This is a popular solution!

Step by step
Solved in 2 steps with 2 images


