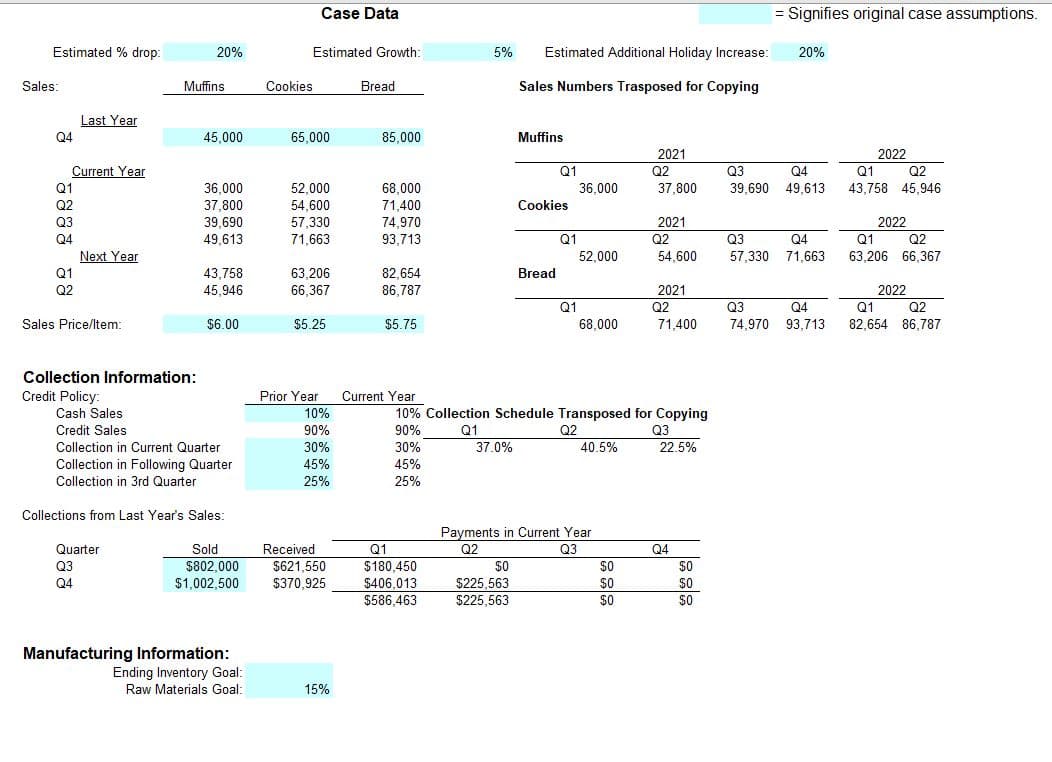
Frenchies is a medium-sized regional bakery that specializes in providing orders to grocery and convenience stores. Because of the popularity of its brand, it has also opened a small café for walk-in business. In order to maintain its high quality standard, Frenchies produces only three products: breakfast muffins, fresh bread, and chocolate chip cookies. Although business has been good in the past few years, a lucky contact with a large chain has recently allowed it to expand its brand out of the local region. Growth has been high since the new contract went into effect. In 2020, Frenchies sold 45,000 one-dozen packages of muffins for $5.50 each, 65,000 one-dozen packages of cookies for $4.75 each, and 85,000 one-dozen loaves of bread for $5.25 each. They will raise prices to $6.00 for muffins, $5.25 for cookies, and $5.75 for bread for 2021. Sales will drop some in the first quarter of 2021. They always drop off a bit after the holidays anyway, but with the increase in sales prices, a 20 percent drop from the fourth quarter of 2020 results is forecasted. Sales will grow steadily at about 5 percent a quarter with these new prices during 2021. Fourth-quarter sales will be high because of the holidays let’s say 20 percent, instead of 5 percent, from the third to the fourth quarter. The first quarter of the 2022 will continue the 5 percent growth as though the holiday jump didn’t occur. Frenchies gives their business customers a lot of leeway in paying. They collect 30 percent of the credit sales within the current quarter, 45 percent in the following quarter, and 25 percent in the quarter after that. Total sales were $802,000 in third quarter and $1,002,500 in the fourth quarter of 2020. They will be still collecting quite a bit of that money in 2021 based on our collection breakdown. Frenchies cookies and bread would dry out if they kept them too long so they normally keep only about two days’ worth of inventory on hand to avoid shipping issues or problems with the café based on a 90-day quarter. Frenchies' raw materials are needed for the next quarter, so they keep 15 percent of the next quarter’s raw materials on hand at all times. 1. General impression/ recommendations for the company after analyzing the budget?


Frenchies is a medium-sized regional bakery that specializes in providing orders to grocery and convenience stores. Because of the popularity of its brand, it has also opened a small café for walk-in business. In order to maintain its high quality standard, Frenchies produces only three products: breakfast muffins, fresh bread, and chocolate chip cookies. Although business has been good in the past few years, a lucky contact with a large chain has recently allowed it to expand its brand out of the local region. Growth has been high since the new contract went into effect. In 2020, Frenchies sold 45,000 one-dozen packages of muffins for $5.50 each, 65,000 one-dozen packages of cookies for $4.75 each, and 85,000 one-dozen loaves of bread for $5.25 each. They will raise prices to $6.00 for muffins, $5.25 for cookies, and $5.75 for bread for 2021. Sales will drop some in the first quarter of 2021. They always drop off a bit after the holidays anyway, but with the increase in sales prices, a 20 percent drop from the fourth quarter of 2020 results is
1. General impression/ recommendations for the company after analyzing the budget?


Trending now
This is a popular solution!

Step by step
Solved in 2 steps

Frenchies is a medium-sized regional bakery that specializes in providing orders to grocery and convenience stores. Because of the popularity of its brand, it has also opened a small café for walk-in business. In order to maintain its high quality standard, Frenchies produces only three products: breakfast muffins, fresh bread, and chocolate chip cookies. Although business has been good in the past few years, a lucky contact with a large chain has recently allowed it to expand its brand out of the local region. Growth has been high since the new contract went into effect. In 2020, Frenchies sold 45,000 one-dozen packages of muffins for $5.50 each, 65,000 one-dozen packages of cookies for $4.75 each, and 85,000 one-dozen loaves of bread for $5.25 each. They will raise prices to $6.00 for muffins, $5.25 for cookies, and $5.75 for bread for 2021. Sales will drop some in the first quarter of 2021. They always drop off a bit after the holidays anyway, but with the increase in sales prices, a 20 percent drop from the fourth quarter of 2020 results is
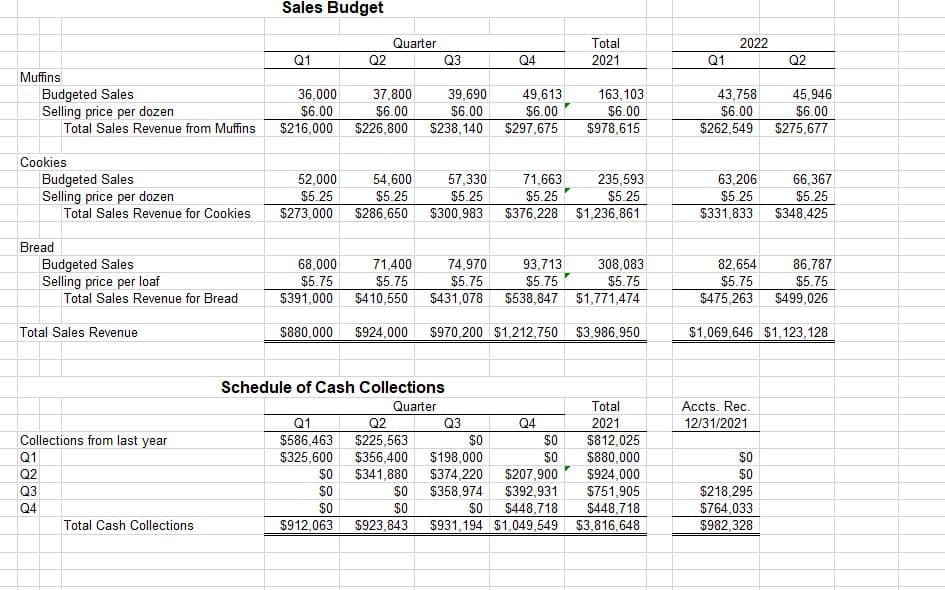
With the information above, how does it translate into the a Production Budget Plan as shown in one of the images?


Can you show the formulas in the cells please?

