From the result above, it can be said that the expected yearly income of a. males is $10,263 more than females given the same age b. females is $10,263 more than males given the same age c. males is $10,263 d. females is $10,263
From the result above, it can be said that the expected yearly income of a. males is $10,263 more than females given the same age b. females is $10,263 more than males given the same age c. males is $10,263 d. females is $10,263

Functions and Change: A Modeling Approach to College Algebra (MindTap Course List)
6th Edition
ISBN:9781337111348
Author:Bruce Crauder, Benny Evans, Alan Noell
Publisher:Bruce Crauder, Benny Evans, Alan Noell
Chapter5: A Survey Of Other Common Functions
Section5.6: Higher-degree Polynomials And Rational Functions
Problem 1TU: The following fictitious table shows kryptonite price, in dollar per gram, t years after 2006. t=...

Related questions
Question
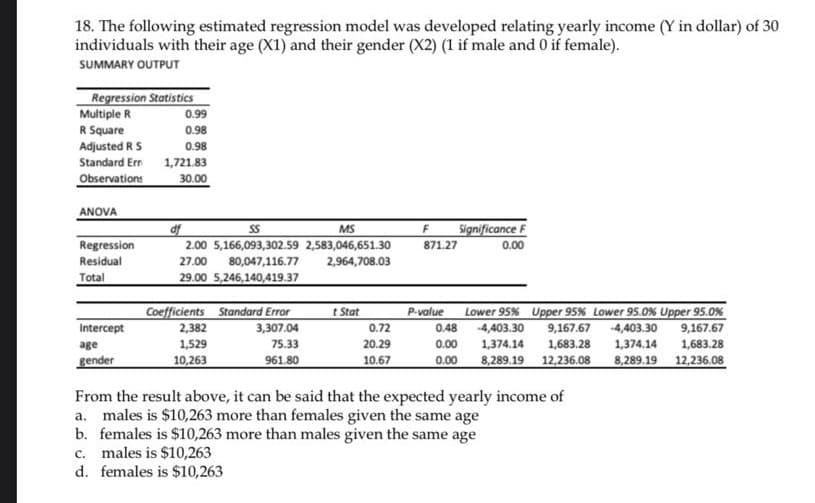
Transcribed Image Text:18. The following estimated regression model was developed relating yearly income (Y in dollar) of 30
individuals with their age (X1) and their gender (X2) (1 if male and 0 if female).
SUMMARY OUTPUT
Regression Statistics
Multipie R
0.99
R Square
0.98
Adjusted R S
0.98
Standard Err
1,721.83
Observations
30.00
ANOVA
df
2.00 5,166,093,302.59 2,583,046,651.30
Significance F
MS
Regression
871.27
0.00
Residual
27.00
80,047,116.77
2,964,708.03
Total
29.00 5,246,140,419.37
Coefficients Standard Error
3,307.04
P-value
Lower 95% Upper 95% Lower 95.0% Upper 95.0%
9,167.67
t Stat
9,167.67
2,382
1,529
Intercept
0.72
0.48
-4,403.30
-4,403.30
age
75.33
20.29
0.00
1,374.14
1,683.28
1,374.14
1,683.28
gender
10,263
961.80
10.67
0.00
8,289.19 12,236.08
8,289.19
12,236.08
From the result above, it can be said that the expected yearly income of
a. males is $10,263 more than females given the same age
b. females is $10,263 more than males given the same age
c. males is $10,263
d. females is $10,263
Expert Solution
This question has been solved!
Explore an expertly crafted, step-by-step solution for a thorough understanding of key concepts.

This is a popular solution!

Trending now
This is a popular solution!

Step by step
Solved in 2 steps

Recommended textbooks for you
Functions and Change: A Modeling Approach to Coll…
Algebra
ISBN:
9781337111348
Author:
Bruce Crauder, Benny Evans, Alan Noell
Publisher:
Cengage Learning

Algebra & Trigonometry with Analytic Geometry
Algebra
ISBN:
9781133382119
Author:
Swokowski
Publisher:
Cengage

College Algebra
Algebra
ISBN:
9781305115545
Author:
James Stewart, Lothar Redlin, Saleem Watson
Publisher:
Cengage Learning
Functions and Change: A Modeling Approach to Coll…
Algebra
ISBN:
9781337111348
Author:
Bruce Crauder, Benny Evans, Alan Noell
Publisher:
Cengage Learning
Algebra & Trigonometry with Analytic Geometry
Algebra
ISBN:
9781133382119
Author:
Swokowski
Publisher:
Cengage
College Algebra
Algebra
ISBN:
9781305115545
Author:
James Stewart, Lothar Redlin, Saleem Watson
Publisher:
Cengage Learning

Linear Algebra: A Modern Introduction
Algebra
ISBN:
9781285463247
Author:
David Poole
Publisher:
Cengage Learning

Algebra and Trigonometry (MindTap Course List)
Algebra
ISBN:
9781305071742
Author:
James Stewart, Lothar Redlin, Saleem Watson
Publisher:
Cengage Learning