GDP is often calculated using the expenditures approach, where you add up all spending in four categories: Consumption (C) + Business Investment (I) + Government Spending (G) + Net Exports (Xn). Based on the data you viewed, you can assume that due to the COVID-19 pandemic, the US GDP took the largest hit from which of the expenditure categories?
-Consumption
-Business Investment
Government -Spending
-Net Exports
GDP is often calculated using the expenditures approach, where you add up all spending in four categories: Consumption (C) + Business Investment (I) + Government Spending (G) + Net Exports (Xn). Based on the data you viewed, you can assume that due to the COVID-19 pandemic, the US GDP took the largest hit from which of the expenditure categories? -Consumption -Business Investment Government -Spending -Net Exports

Macroeconomics: Principles and Policy (MindTap Course List)
13th Edition
ISBN:9781305280601
Author:William J. Baumol, Alan S. Blinder
Publisher:William J. Baumol, Alan S. Blinder
Chapter8: Aggregate Demand And The Powerful Consumer
Section: Chapter Questions
Problem 8DQ

Related questions
Question
-Consumption
-Business Investment Government
-Spending
-Net Exports
Transcribed Image Text:1.800
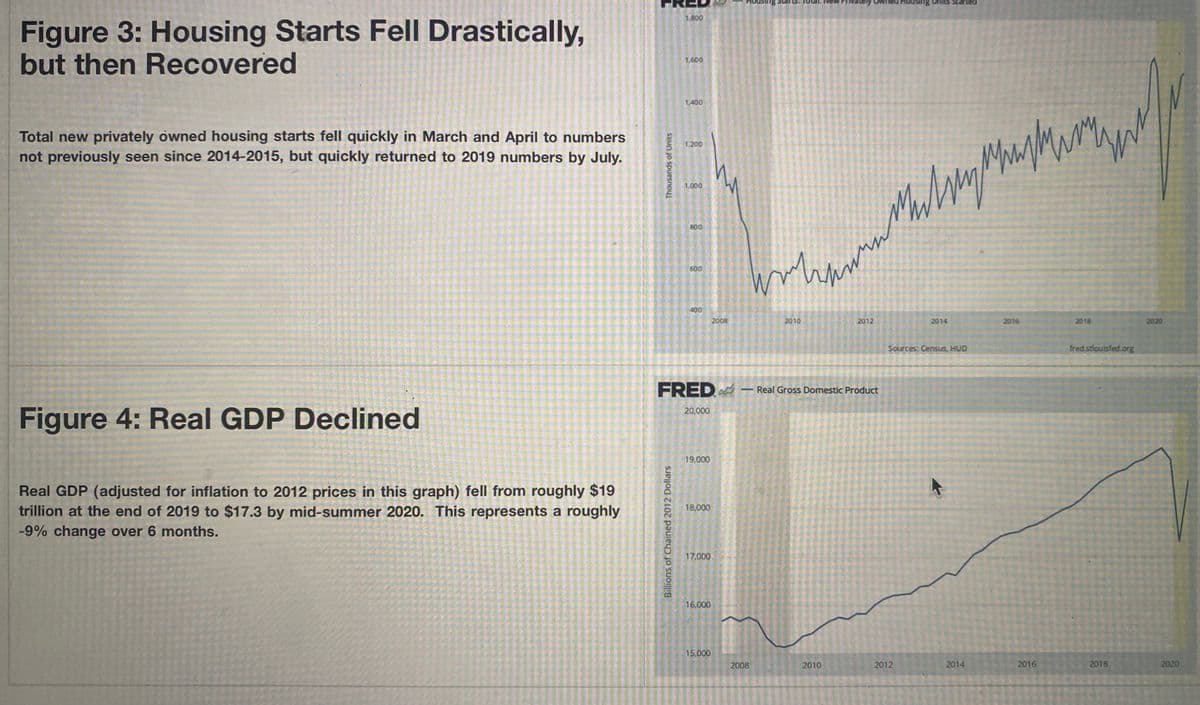
Figure 3: Housing Starts Fell Drastically,
but then Recovered
1,600
1,400
Total new privately owned housing starts fell quickly in March and April to numbers
not previously seen since 2014-2015, but quickly returned to 2019 numbers by July.
my
1.200
1,000
800
600
400
2008
2010
2012
2014
2016
2018
2020
Sources: Census, HUD
fred.stloutsfed.org
FRED – Real Gross Domestic Product
Figure 4: Real GDP Declined
20,000
19,000
Real GDP (adjusted for inflation to 2012 prices in this graph) fell from roughly $19
trillion at the end of 2019 to $17.3 by mid-summer 2020. This represents a roughly
-9% change over 6 months.
18,000
17,000.
16,000
15,000
2008
2010
2012
2014
2016
2018
2020
Billions of Chained 2012 Dollars
Thousands of Units
Transcribed Image Text:sa group, review the follówing
FRED - Adance Roal Retalland Food Senices Sales
220.000
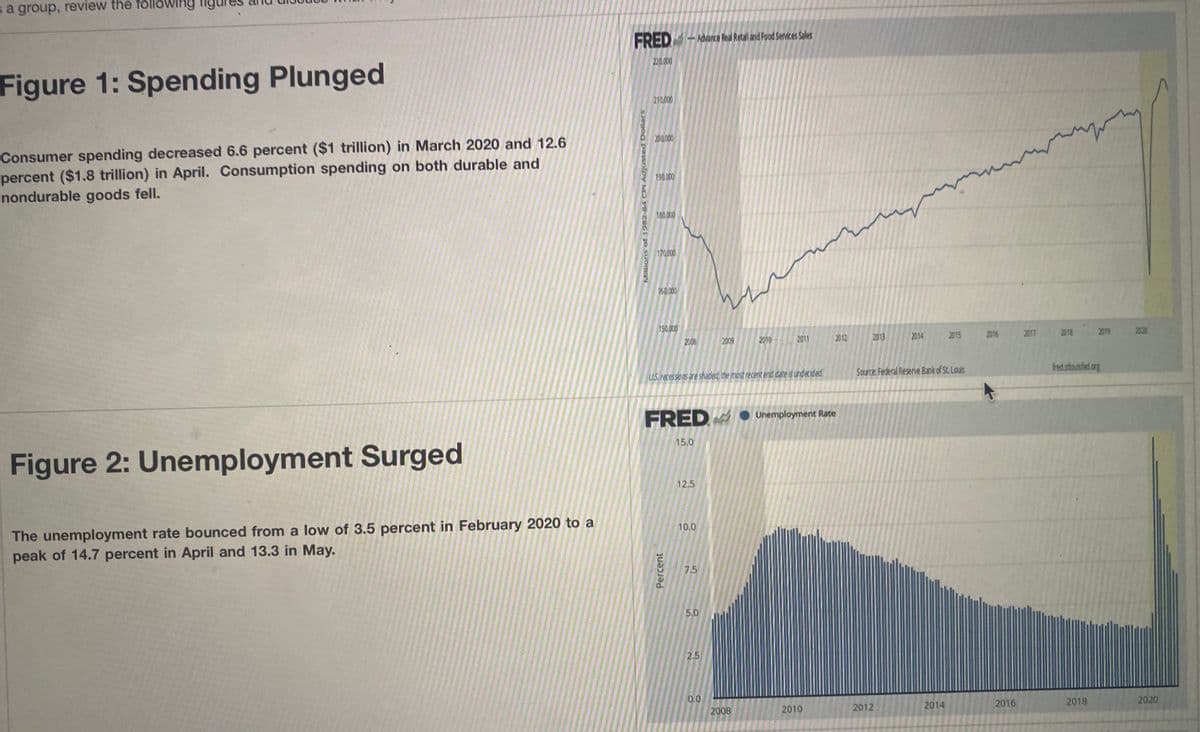
Figure 1: Spending Plunged
210.000
200 000
Consumer spending decreased 6.6 percent ($1 trillion) in March 2020 and 12.6
percent ($1.8 trillion) in April. Consumption spending on both durable and
nondurable goods fell.
190.000
180.000
170.000
160.000
150.000
2008
2014
2015
2016
2017
2018 2019 2020
2009
2010
2011
2012
2013
Source Federal Reserve Bank of St. Louis
fredstlouisfed org
US recessions are shaded the most recent end date is undecided
FRED
● Unemployment Rate
15.0
Figure 2: Unemployment Surged
12.5
The unemployment rate bounced from a low of 3.5 percent in February 2020 to a
peak of 14.7 percent in April and 13.3 in May.
10.0
7.5
5.0
2.5
0.0
2016
2018
2020
2008
2010
2012
2014
Millions of 1982-84 CPI Adjusted Dollars
Percent
Expert Solution
This question has been solved!
Explore an expertly crafted, step-by-step solution for a thorough understanding of key concepts.

This is a popular solution!

Trending now
This is a popular solution!

Step by step
Solved in 2 steps

Knowledge Booster


Learn more about
Need a deep-dive on the concept behind this application? Look no further. Learn more about this topic, economics and related others by exploring similar questions and additional content below.Recommended textbooks for you
Macroeconomics: Principles and Policy (MindTap Co…
Economics
ISBN:
9781305280601
Author:
William J. Baumol, Alan S. Blinder
Publisher:
Cengage Learning


Macroeconomics: Principles and Policy (MindTap Co…
Economics
ISBN:
9781305280601
Author:
William J. Baumol, Alan S. Blinder
Publisher:
Cengage Learning

Brief Principles of Macroeconomics (MindTap Cours…
Economics
ISBN:
9781337091985
Author:
N. Gregory Mankiw
Publisher:
Cengage Learning

Essentials of Economics (MindTap Course List)
Economics
ISBN:
9781337091992
Author:
N. Gregory Mankiw
Publisher:
Cengage Learning

Principles of Economics 2e
Economics
ISBN:
9781947172364
Author:
Steven A. Greenlaw; David Shapiro
Publisher:
OpenStax