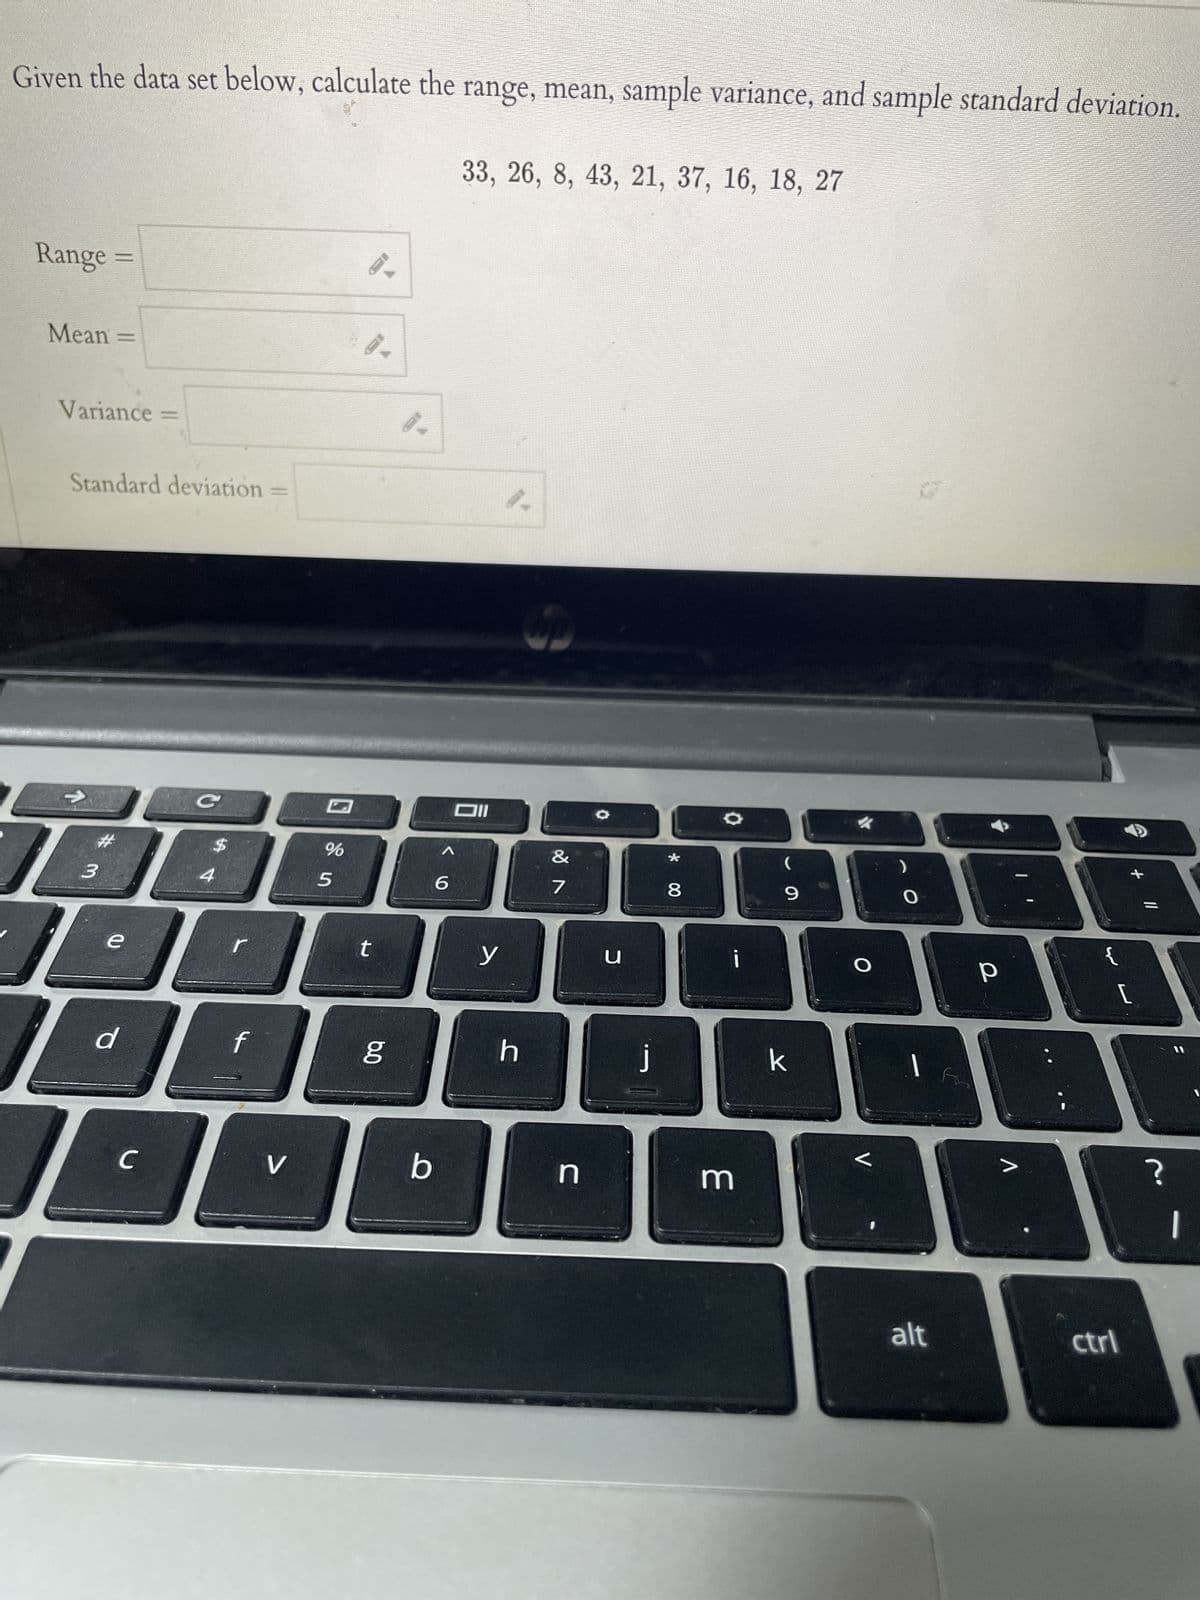
Given the data set below, calculate the range, mean, sample variance, and sample standard deviation. Range = Mean = Variance = Standard deviation B 33, 26, 8, 43, 21, 37, 16, 18, 27
Q: A researcher takes sample temperatures in Fahrenheit of 20 days from Portland (Group 1) and 19 days…
A: to test the claim that the mean temperature in Portland is different than the mean temperature in…
Q: Let Y: → {-1, 1} be a binary variable Y and consider its prediction from a variable X: N→ R. Prove…
A: In the given question, there are 2 variables: Y, which is a binary variable taking values {-1, 1},…
Q: The diagram below shows a graph of a normal curve. The mean and the number of standard deviations…
A: Mean Standard deviation
Q: cted from normally distributed populations, and do not assume that the population standard…
A: The data is given as-Diet=sample1Regular=sample2n29290.788850.80421s0.004340.00749
Q: Part 1 of 2 (a) Construct a 98% confidence interval for the mean increase in water loss. Let of…
A: Let be the population mean difference water loss between after and before skin removal.Given that,
Q: of statistics students in Oxnard College recorded the amount of rain ing the intensity by the inches…
A:
Q: Thanks to an initiative to recruit top students, an administrator at a college claims that this…
A: Answer Mean =116Standard deviation =10sample size =19level of significance =0.05
Q: Using all 1991 birth records in the computerized national birth certificate registry compiled by the…
A: From the provided information,Mean (µ) = 3432 gStandard deviation (σ) = 482 gX~N (3432, 482)
Q: Directiong QNO1e (a) using gather for calculate central the information you Assement the measure of…
A: First, we will create a frequency distribution for the given data on rape cases.Number of cases…
Q: x P(X = x) -2 2 10 0.39 0.69 0.12
A: Determine whether or not the distribution is a discrete probability distribution and select the…
Q: A manager is trying to educate employees on the effects of personal health and workplace…
A: Given that the manager has gathered data from a group of employees to evaluate the effects of sleep…
Q: Based on the data shown below, calculate the correlation coefficient (to three decimal places) X y 4…
A:
Q: Find the mean and the median for each of the two samples and then answer the question following the…
A: Answer given 30 days in advance 244,260,264,264,278,318,2801 day in…
Q: You may need to use the appropriate appendix table or technology to answer this question. A group…
A: Mean()=23858standard deviation()=5500
Q: You may need to use the appropriate appendix table or technology to answer this question. What is…
A:
Q: Use the expression in the accompanying discussion of sample size to find the size of each sample if…
A: The given confidence level is 95% and the margin of error is 0.045.
Q: The display provided from technology available below results from using data for a smartphone…
A: From the given display image:Sample size Sample mean Standard deviation Level of significance
Q: Find the 44th percentile, P44, from the following data 15 6 9 11 15 21 22 27 33 37 38 40 60 61 62 75…
A: 1,5,6,9,11,13,15,21,22,27,32,33,37,38,40,46,55,60,61,62,65,66,75,82,83,85,86,89,91,97sample…
Q: Suppose that 45 students were asked how many courses they were taking this semester. The…
A: There are totally 45 students in the semester and missing values table is given
Q: Which of the following statements are true? There may be more than one correct statement; check all…
A: The true statement(s) has to be identified.
Q: A school principal A survey over the school year produced the following results. Using a 0.05 level…
A: MonthNumberAug15Sep17Oct18Nov17Dec12Jan11Feb6Mar18Apr7May6n=127
Q: You may need to use the appropriate appendix table or technology to answer this question. A simple…
A: sample size(n)=40sample mean()=25population standard deviation()=5
Q: You are testing the claim that the mean GPA of night students is different from the mean GPA of day…
A: Mean()=5.68standard deviation(s1)=0.75sample size(n1)=35Mean()=2.45standard deviation(s2)=0.49sample…
Q: Determine which numbers could not be used to represent the probability of an event. Select all that…
A: The numbers are given to represent the probability of an event.
Q: A real estate office wants to make a survey in a certain town, which has 50,000 households, to…
A: A town has 50000 households.A survey was conducted to determine how far the head of household has to…
Q: We would like to estimate the mean of a population which has a standard deviation of o= 60 using a…
A: Population standard deviation Confidence level is 95% i.e., 0.95Margin of error E=2.
Q: 64% of all bald eagles survive their first year of life. If 49 bald eagles are randomly selected,…
A: The question is about discrete prob. distributionGiven :Prop. of all bald eagles survive their first…
Q: 3. Suppose a group of four cookies will be selected from a jar that has 12 chocolate-chip and 10…
A:
Q: Suppose our target population is very large. To each observational unit we have a two- attribute…
A:
Q: (b) The intelligent quotient of students in UTHM have a mean of 95 and a standard deviation of 10.…
A: Mean=M=95, Standard deviation=S=10
Q: A deck of four (4) cards has exactly one (1) color printed on each face – blue, yellow, red, or…
A: From the provided information,The probability distribution table is as follow:XP…
Q: In order to estimate the average time spent per student on the computer terminals at a local…
A: sample size(n) = 81population standard deviation = 1.5 hoursstandard error for mean = ?
Q: Bill and Chris are playing a game that involves a spinner. They have observed the following facts…
A: Following the conditions of the spinner (where four outcome numbers are equally likely), consider…
Q: Please round to the nearest integer (no decimals): A fair coin is tossed 1,000 times. Suppose the…
A: A fair coin is tossed 1,000 times. Suppose the coin lands on heads 529 times.
Q: You may need to use the appropriate appendix table or technology to answer this question. Older…
A: The question is about confidence intervalGiven :To find :a ) Pt. estimate of the popl. mean no. of…
Q: Please answer parts a thru d quickly and correctly On a rainy day, 30% of people carry an umbrella,…
A: Let's denote the event of carrying an umbrella as and the event of wearing a raincoat as . We are…
Q: 86 14 620 51 0 60 209 40 184 0 2 54 hat requirements must be satisfied? Select all that apply. A. At…
A: If the population is normally distributed then the sampling distribution is also normally…
Q: Let X_1, X_2, ... , X_2 be i.i.d. from Normal(0, sigma^2), sigma > 0 (a) Find the maximum…
A: The question involves the estimation of the variance () of a normal distribution using maximum…
Q: Let Y:{-1, 1} be a binary variable Y and consider its prediction from a variable X: →R. Prove that…
A: In the given question, we are dealing with two variables: Y, which is a binary variable taking…
Q: In a study of treatments for very painful "cluster" headaches, 160 patients were treated with oxygen…
A: The question is about hypo. testingGiven :Total no. of patients treated with oxygen ( n1 ) = 160No.…
Q: Assume a member is selected at random from the population represented by the graph. Find the…
A: normal distributionP(283<x<291) = ? area under normal curve represents probability.
Q: e of water by the residents of a small town in gallons per day. Th tudy found that for an average…
A:
Q: You are hired to study the statistical relationship between the number of trees and the number of…
A: To start with, we will define neighborhoods in a city or use pre-existing definitions (based on PIN…
Q: 1. Getting a good night's sleep is essential for teenage students to perform optimally during…
A: a) Here are the null and alternative hypotheses stated :Null hypothesis (H₀): The population mean…
Q: a. What is the distribution of X? X - N( b. What is the distribution of x? x - N( c. For a single…
A: It is given that Mean, μ = 136000Standard deviation, σ = 39000Sample size, n = 9Note: According to…
Q: In a study of cell phone usage and brain hemispheric dominance, an Internet survey was e-mailed to…
A: sample size(n)=6988x=1292significance level()=0.01sample proportion()=
Q: SAT score and position in company. management 17 27 16 10 Can
A: To determine whether there is a relationship between SAT score and position at the 10% significance…
Q: The population proportion is 0.20. What is the probability that a sample proportion will be within…
A: Population Proportion:The population proportion is the proportion of the occurrence of a particular…
Q: What is the probability that there are between 26 and 35 messages in the next hour? 2. What is the…
A: You and your friends have a large messaging group on GroupMe. The number of messages that are…
Q: A newspaper published an article about a study in which researchers subjected laboratory gloves to…
A: The question is about hypo. testing and Confidence intervalGiven :Total no. of vinyl glov. ( n1 ) =…
Trending now
This is a popular solution!
Step by step
Solved in 3 steps with 6 images