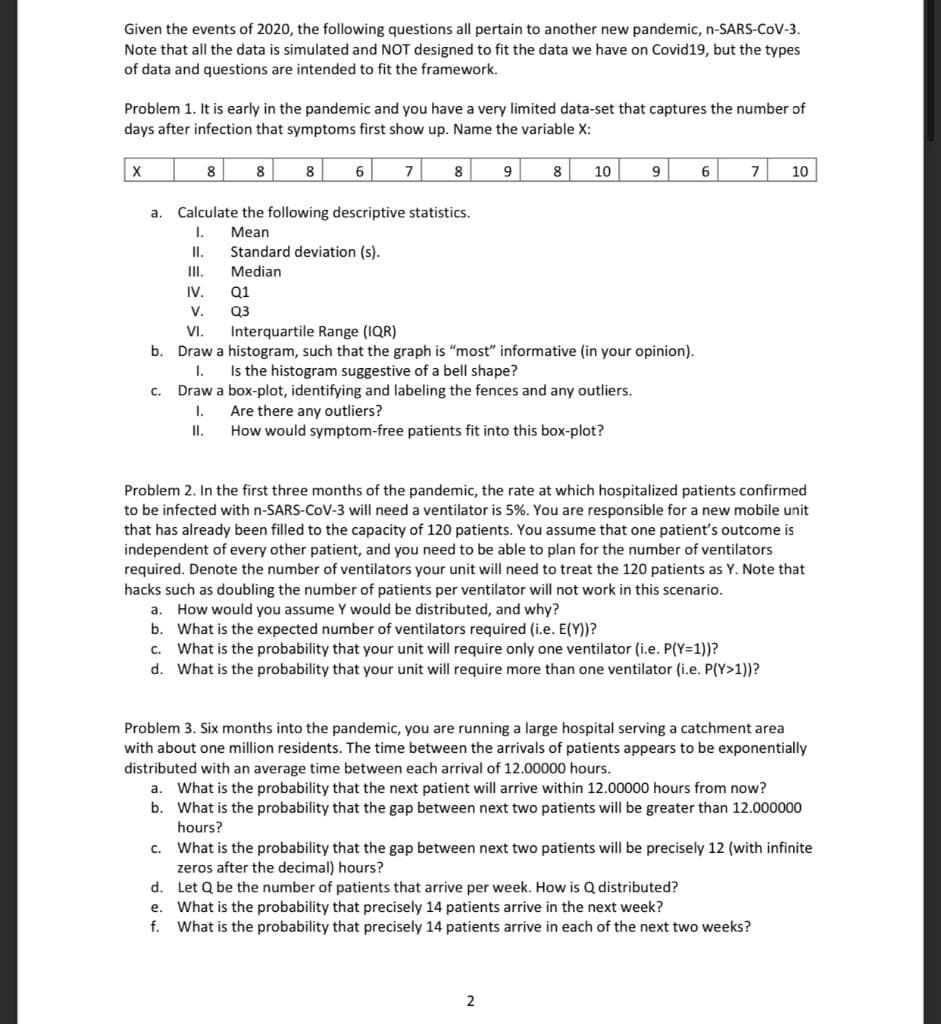
Given the events of 2020, the following questions all pertain to another new pandemic, n-SARS-CoV-3. Note that all the data is simulated and NOT designed to fit the data we have on Covid19, but the types of data and questions are intended to fit the framework. Problem 1. It is early in the pandemic and you have a very limited data-set that captures the number of days after infection that symptoms first show up. Name the variable X: 6 10 7 8 8 8 8 8 10 a. Calculate the following descriptive statistics. 1. Мean II. Standard deviation (s). I. Median IV. Q1 v. Interquartile Range (1QR) Q3 VI. b. Draw a histogram, such that the graph is "most" informative (in your opinion). 1. Is the histogram suggestive of a bell shape? c. Draw a box-plot, identifying and labeling the fences and any outliers. I. Are there any outliers? II. How would symptom-free patients fit into this box-plot? Problem 2. In the first three months of the pandemic, the rate at which hospitalized patients confirmed to be infected with n-SARS-CoV-3 will need a ventilator is 5%. You are responsible for a new mobile unit that has already been filled to the capacity of 120 patients. You assume that one patient's outcome is independent of every other patient, and you need to be able to plan for the number of ventilators required. Denote the number of ventilators your unit will need to treat the 120 patients as Y. Note that hacks such as doubling the number of patients per ventilator will not work in this scenario. a. How would you assume Y would be distributed, and why? b. What is the expected number of ventilators required (i.e. E(Y))? c. What is the probability that your unit will require only one ventilator (i.e. P(Y=1))? d. What is the probability that your unit will require more than one ventilator (i.e. P(Y>1))? Problem 3. Six months into the pandemic, you are running a large hospital serving a catchment area with about one million residents. The time between the arrivals of patients appears to be exponentially distributed with an average time between each arrival of 12.00000 hours. a. What is the probability that the next patient will arrive within 12.00000 hours from now? b. What is the probability that the gap between next two patients will be greater than 12.000000 hours? c. What is the probability that the gap between next two patients will be precisely 12 (with infinite zeros after the decimal) hours? d. Let Q be the number of patients that arrive per week. How is Q distributed? e. What is the probability that precisely 14 patients arrive in the next week? f. What is the probability that precisely 14 patients arrive in each of the next two weeks? 9,


Family of Curves
A family of curves is a group of curves that are each described by a parametrization in which one or more variables are parameters. In general, the parameters have more complexity on the assembly of the curve than an ordinary linear transformation. These families appear commonly in the solution of differential equations. When a constant of integration is added, it is normally modified algebraically until it no longer replicates a plain linear transformation. The order of a differential equation depends on how many uncertain variables appear in the corresponding curve. The order of the differential equation acquired is two if two unknown variables exist in an equation belonging to this family.
XZ Plane
In order to understand XZ plane, it's helpful to understand two-dimensional and three-dimensional spaces. To plot a point on a plane, two numbers are needed, and these two numbers in the plane can be represented as an ordered pair (a,b) where a and b are real numbers and a is the horizontal coordinate and b is the vertical coordinate. This type of plane is called two-dimensional and it contains two perpendicular axes, the horizontal axis, and the vertical axis.
Euclidean Geometry
Geometry is the branch of mathematics that deals with flat surfaces like lines, angles, points, two-dimensional figures, etc. In Euclidean geometry, one studies the geometrical shapes that rely on different theorems and axioms. This (pure mathematics) geometry was introduced by the Greek mathematician Euclid, and that is why it is called Euclidean geometry. Euclid explained this in his book named 'elements'. Euclid's method in Euclidean geometry involves handling a small group of innately captivate axioms and incorporating many of these other propositions. The elements written by Euclid are the fundamentals for the study of geometry from a modern mathematical perspective. Elements comprise Euclidean theories, postulates, axioms, construction, and mathematical proofs of propositions.
Lines and Angles
In a two-dimensional plane, a line is simply a figure that joins two points. Usually, lines are used for presenting objects that are straight in shape and have minimal depth or width.
alll.

Step by step
Solved in 2 steps with 5 images


