Given the indicated maturities listed in the following table, assume the following yields for U.S. Treasury securities Maturity (Years) 1 5 10 20 30 Yield (%) 2.0 3.1 3.8 4.6 5.5 On the following graph, plot the yield curve implied by these interest rates. Place a blue point (circle symbol) at each maturity and interest rate in the table, and the yield curve will draw itself. Tool tip: Mouse over the points on the graph to see their coordinates. INTEREST RATE (Percent) 10 Yield Curve 8 7 5 2 1 0 5 10 15 20 25 30 MATURITY (Years) Clear All The graph's yield curve is referred to as yield curve. Based on the yield curve shown, which of the following statements is true? Corporate bond yield curves are lower than U.S. Treasury bond yield curves. Interest rates on short-term maturities are lower than rates on long-term maturities. co
Given the indicated maturities listed in the following table, assume the following yields for U.S. Treasury securities Maturity (Years) 1 5 10 20 30 Yield (%) 2.0 3.1 3.8 4.6 5.5 On the following graph, plot the yield curve implied by these interest rates. Place a blue point (circle symbol) at each maturity and interest rate in the table, and the yield curve will draw itself. Tool tip: Mouse over the points on the graph to see their coordinates. INTEREST RATE (Percent) 10 Yield Curve 8 7 5 2 1 0 5 10 15 20 25 30 MATURITY (Years) Clear All The graph's yield curve is referred to as yield curve. Based on the yield curve shown, which of the following statements is true? Corporate bond yield curves are lower than U.S. Treasury bond yield curves. Interest rates on short-term maturities are lower than rates on long-term maturities. co

Chapter8: Analysis Of Risk And Return
Section: Chapter Questions
Problem 14P

Related questions
Question
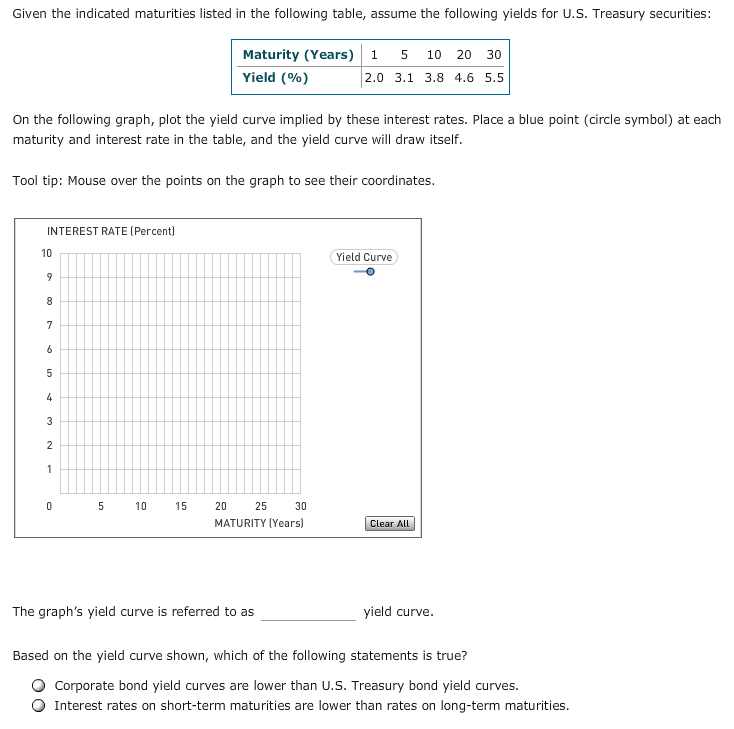
Transcribed Image Text:Given the indicated maturities listed in the following table, assume the following yields for U.S. Treasury securities
Maturity (Years)
1
5
10
20
30
Yield (%)
2.0 3.1 3.8 4.6 5.5
On the following graph, plot the yield curve implied by these interest rates. Place a blue point (circle symbol) at each
maturity and interest rate in the table, and the yield curve will draw itself.
Tool tip: Mouse over the points on the graph to see their coordinates.
INTEREST RATE (Percent)
10
Yield Curve
8
7
5
2
1
0
5
10
15
20
25
30
MATURITY (Years)
Clear All
The graph's yield curve is referred to as
yield curve.
Based on the yield curve shown, which of the following statements is true?
Corporate bond yield curves are lower than U.S. Treasury bond yield curves.
Interest rates on short-term maturities are lower than rates on long-term maturities.
co
Expert Solution
This question has been solved!
Explore an expertly crafted, step-by-step solution for a thorough understanding of key concepts.

This is a popular solution!

Trending now
This is a popular solution!

Step by step
Solved in 3 steps with 1 images

Recommended textbooks for you
EBK CONTEMPORARY FINANCIAL MANAGEMENT
Finance
ISBN:
9781337514835
Author:
MOYER
Publisher:
CENGAGE LEARNING - CONSIGNMENT

Intermediate Financial Management (MindTap Course…
Finance
ISBN:
9781337395083
Author:
Eugene F. Brigham, Phillip R. Daves
Publisher:
Cengage Learning
EBK CONTEMPORARY FINANCIAL MANAGEMENT
Finance
ISBN:
9781337514835
Author:
MOYER
Publisher:
CENGAGE LEARNING - CONSIGNMENT
Intermediate Financial Management (MindTap Course…
Finance
ISBN:
9781337395083
Author:
Eugene F. Brigham, Phillip R. Daves
Publisher:
Cengage Learning