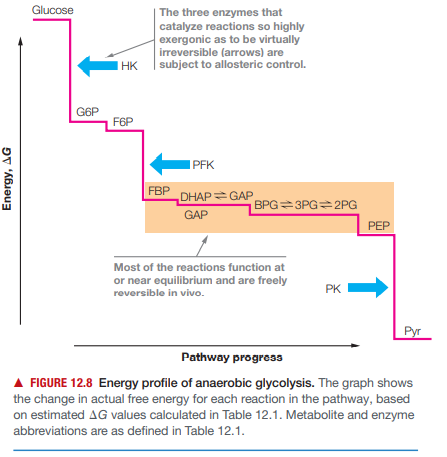
Glucose | The three enzymes that catalyze reactions so highly exergonic as to be virtually irreversible (arrows) are I HK subject to allosteric control. G6P F6P IPFK FBP DHAP GAP |BPG=3PG=2PG GAP PEP Most of the reactions function at or near equilibrium and are freely PK reversible in vivo. Pyr Pathway progress A FIGURE 12.8 Energy profile of anaerobic glycolysis. The graph shows the change in actual free energy for each reaction in the pathway, based on estimated AG values calculated in Table 12.1. Metabolite and enzyme abbreviations are as defined in Table 12.1. Energy, AG


Electron Transport Chain
The electron transport chain, also known as the electron transport system, is a group of proteins that transfer electrons through a membrane within mitochondria to create a gradient of protons that drives adenosine triphosphate (ATP)synthesis. The cell uses ATP as an energy source for metabolic processes and cellular functions. ETC involves series of reactions that convert redox energy from NADH (nicotinamide adenine dinucleotide (NAD) + hydrogen (H)) and FADH2(flavin adenine dinucleotide (FAD)) oxidation into proton-motive force(PMF), which is then used to synthesize ATP through conformational changes in the ATP synthase complex, a process known as oxidative phosphorylation.
Metabolism
Picture a campfire. It keeps the body warm on a cold night and provides light. To ensure that the fire keeps burning, fuel needs to be added(pieces of wood in this case). When a small piece is added, the fire burns bright for a bit and then dies down unless more wood is added. But, if too many pieces are placed at a time, the fire escalates and burns for a longer time, without actually burning away all the pieces that have been added. Many of them, especially the larger chunks or damp pieces, remain unburnt.
Cellular Respiration
Cellular respiration is the cellular process involved in the generation of adenosine triphosphate (ATP) molecules from the organic nutritional source obtained from the diet. It is a universal process observed in all types of life forms. The glucose (chemical formula C6H12O6) molecules are the preferred raw material for cell respiration as it possesses a simple structure and is highly efficient in nature.
Refer to Figure, which indicates ∆G for each glycolytic reaction under intracellular conditions. Assume that glyceraldehyde-3-phosphate dehydrogenase was inhibited with iodoacetate, which reacts with its active site cysteine sulfhydryl group. Which glycolytic intermediate would you expect to accumulate most rapidly, and why?


Trending now
This is a popular solution!

Step by step
Solved in 2 steps


