Graduation Rates. Refer to Exercise A.45. Use the technology of your choice to do the following. a. Obtain the scatterplot matrix for the data. b. Use the scatterplot matrix to assess whether a multiple linear regression model might be appropriate for predicting graduation rate. c. Determine the regression equation for the data. d. Apply the regression equation to predict the graduation rate at a school where the student-to-faculty ratio is 18 to 1, 70% of the freshmen were in the top 10% of their high-school class, and 75% of the applicants are accepted. (The values of the predictor variables are 18, 70, and 75, respectively.)


Graduation Rates. Refer to Exercise A.45. Use the technology of your choice to do the following.
a. Obtain the
b. Use the scatterplot matrix to assess whether a multiple linear regression model might be appropriate for predicting graduation rate.
c. Determine the regression equation for the data.
d. Apply the regression equation to predict the graduation rate at a school where the student-to-faculty ratio is 18 to 1, 70% of the freshmen were in the top 10% of their high-school class, and 75% of the applicants are accepted. (The values of the predictor variables are 18, 70, and 75, respectively.)
a)
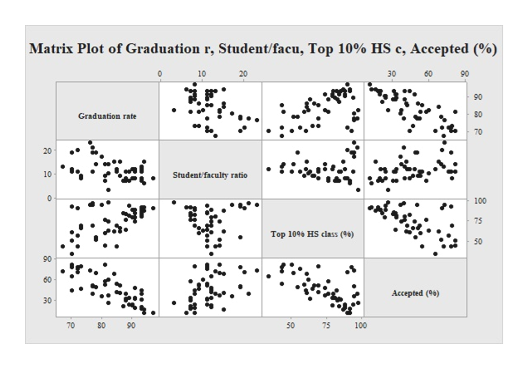
Scatterplot matrix:
Software procedure:
Step by step procedure to draw scatterplot matrix using Minitab software is given as,
- Choose Graph > Matrix plot.
- Choose Simple, and then click OK.
- Under Graph variables, enter the columns of Graduation rate (y), Student/faculty ratio (x1), Top 10% HS class (%) (x2), Accepted (%) (x3).
- Click OK.
The output using Minitab software is given as,
b)
Careful inspection of the output shows that the relationship between graduation rate-and-student/faculty ratio and between graduation rate-and-percent applied are close to linear in the negative direction, whereas the relationships between graduation rate-and-top 10% is close to linear in the positive direction.
Thus, using the scatterplot matrix in output, it can be determined that a multiple linear regression model might be appropriate for predicting graduation rate.
c.
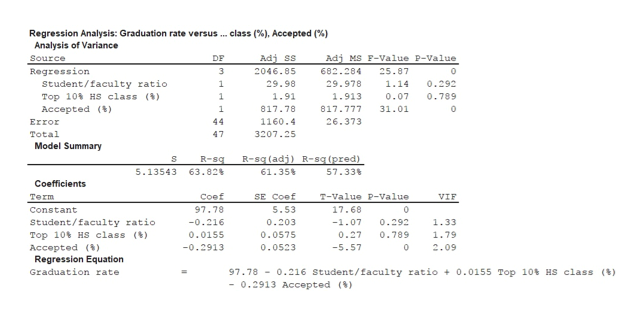
Regression:
Software procedure:
Step by step procedure to draw scatterplot matrix using Minitab software is given as,
- Choose Stat > Regression > Regression > Fit Regression Model.
- Under Responses, enter the column of Graduation rate (y).
- Under Continuous predictors, enter the columns of Student/faculty ratio (x1), Top 10% HS class (%) (x3), Accepted (%) (x3).
- Click Results and select options Method, Analysis of variance, Model summary, Coefficients, Regression equation and click OK.
- Click OK.
The output using Minitab software is given as,

Step by step
Solved in 7 steps with 4 images


