Graph the Tollowing data mL of NaOH (x-axis) pH (у-аxis) 3.00 1.00 4.05 2.50 4.52 5.00 5.00 7.50 5.48 8.75 5.85 9.50 6.28 9.75 6.59 9.90 7.00 10.00 8.85 10.10 10.70 10.25 11.09 10.50 11.39 12.75 12.08 15.00 12.30 The graph must contain the following: 1. Select the x,y scatter plot chart to graph data o scatter smooth lines 2. Chart title above the chart and must include your name, section number 3. Axes must be labeled ( remember to include units where applicable) 4. No legend 5. No trendline
Graph the Tollowing data mL of NaOH (x-axis) pH (у-аxis) 3.00 1.00 4.05 2.50 4.52 5.00 5.00 7.50 5.48 8.75 5.85 9.50 6.28 9.75 6.59 9.90 7.00 10.00 8.85 10.10 10.70 10.25 11.09 10.50 11.39 12.75 12.08 15.00 12.30 The graph must contain the following: 1. Select the x,y scatter plot chart to graph data o scatter smooth lines 2. Chart title above the chart and must include your name, section number 3. Axes must be labeled ( remember to include units where applicable) 4. No legend 5. No trendline

Chemistry
10th Edition
ISBN:9781305957404
Author:Steven S. Zumdahl, Susan A. Zumdahl, Donald J. DeCoste
Publisher:Steven S. Zumdahl, Susan A. Zumdahl, Donald J. DeCoste
Chapter1: Chemical Foundations
Section: Chapter Questions
Problem 1RQ: Define and explain the differences between the following terms. a. law and theory b. theory and...

Related questions

Question
pleaseee please answer quickly!
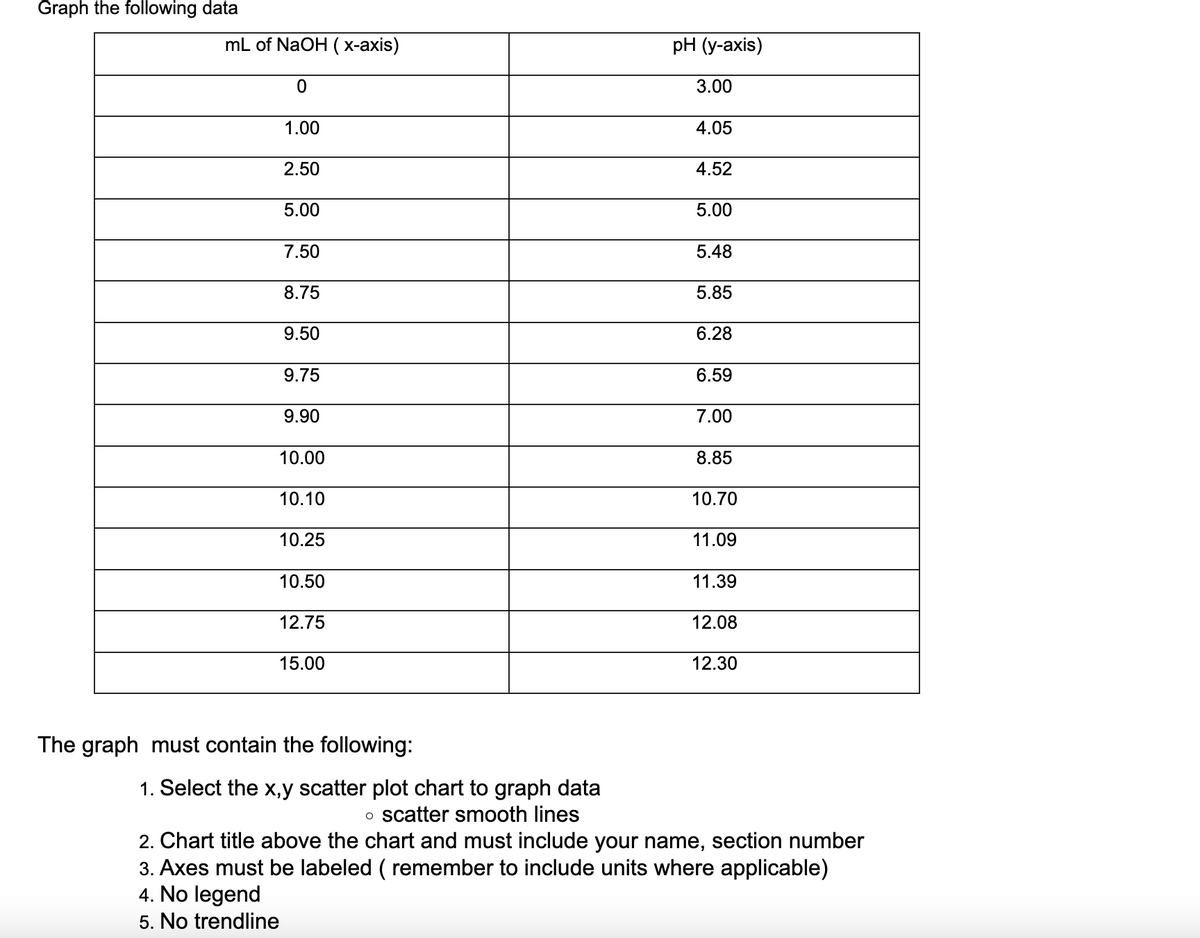
Transcribed Image Text:Graph the following data
mL of NaOH ( x-axis)
pH (у-аxis)
3.00
1.00
4.05
2.50
4.52
5.00
5.00
7.50
5.48
8.75
5.85
9.50
6.28
9.75
6.59
9.90
7.00
10.00
8.85
10.10
10.70
10.25
11.09
10.50
11.39
12.75
12.08
15.00
12.30
The graph must contain the following:
1. Select the x,y scatter plot chart to graph data
o scatter smooth lines
2. Chart title above the chart and must include your name, section number
3. Axes must be labeled ( remember to include units where applicable)
4. No legend
5. No trendline
Expert Solution
Step 1
Given,
mL of NaOH and pH data are provided
Required,
A scatter plot that should contain -
1. Scatter smooth lines
2. Chart title above the chart
3. Proper label of the axes
4. No legend
5. No trendline

Step by step
Solved in 3 steps with 1 images

Knowledge Booster


Learn more about
Need a deep-dive on the concept behind this application? Look no further. Learn more about this topic, chemistry and related others by exploring similar questions and additional content below.Recommended textbooks for you
Chemistry
Chemistry
ISBN:
9781305957404
Author:
Steven S. Zumdahl, Susan A. Zumdahl, Donald J. DeCoste
Publisher:
Cengage Learning

Chemistry
Chemistry
ISBN:
9781259911156
Author:
Raymond Chang Dr., Jason Overby Professor
Publisher:
McGraw-Hill Education

Principles of Instrumental Analysis
Chemistry
ISBN:
9781305577213
Author:
Douglas A. Skoog, F. James Holler, Stanley R. Crouch
Publisher:
Cengage Learning
Chemistry
Chemistry
ISBN:
9781305957404
Author:
Steven S. Zumdahl, Susan A. Zumdahl, Donald J. DeCoste
Publisher:
Cengage Learning
Chemistry
Chemistry
ISBN:
9781259911156
Author:
Raymond Chang Dr., Jason Overby Professor
Publisher:
McGraw-Hill Education
Principles of Instrumental Analysis
Chemistry
ISBN:
9781305577213
Author:
Douglas A. Skoog, F. James Holler, Stanley R. Crouch
Publisher:
Cengage Learning

Organic Chemistry
Chemistry
ISBN:
9780078021558
Author:
Janice Gorzynski Smith Dr.
Publisher:
McGraw-Hill Education

Chemistry: Principles and Reactions
Chemistry
ISBN:
9781305079373
Author:
William L. Masterton, Cecile N. Hurley
Publisher:
Cengage Learning

Elementary Principles of Chemical Processes, Bind…
Chemistry
ISBN:
9781118431221
Author:
Richard M. Felder, Ronald W. Rousseau, Lisa G. Bullard
Publisher:
WILEY