hGraphs of Functions; Properties of Functions In Problems 69-76, use a aproximate any local maxima and local minima. Determine where the function is increasing and where it is decreasing. Round answers to two decimal places. graphing utility to graph each function over the indicated interval and C Sro 69. f(x) = x-3x + 2; (-2, 2) 70. f(x) x- 3x +5; (-1,3) 71. fx) = -x; (-2, 2) 72. f(x) xx; (-2,2) 1E0- x S 73. f(x) =-0.2x3 - 0.6x2 4x- 6; (-6, 4) 74. f(x) 0.4x3 0.6x2 3x - 2; (-4,5) saU 00) 75. f(x) = 0.25x4 +0.3x3 0.9x +3; (-3,2) mst: C td) 20ido 76. f(x) 0.4x4 0.5x3 0.8x2 2; (-3, 2) (a) Determine the height of the golf ball after it has 1. For the function f(x) = x2, compute each average rate of change: CE 100 feet. (b) What is the height after it has traveled 300 feet? (c) What is the height after it has traveled 500 feet? (d) How far was the golf ball hit? (e) Use a graphing utility to graph the function h = (f) Use a graphing utility to determine the distance ball has traveled when the height of the ball is 90 (g) Create a TABLE with TblStart 0 and ATbl 2. (h) To the nearest 25 feet, how far does the ball travel reaches a maximum height? What is the maximum Adiust the value of ATbl until you determine ,0) toin (c) from 0 to 0.1 (a) from 0 to 1 (b) from 0 to 0.01 (d) from 0 to 0.5 2-AZ bs x (e) from 0 to 0.00 1 (t) Graph each of the secant lines. Set the viewing rectangle -0.2, Xmay = 1.2, Xscl = 0.1, Ymin = -0.2, 1.2, Yscl 0 to: Xmin Ymax What do you think (h) What is happenir ecant lines? he secant lines? oser to? What is
hGraphs of Functions; Properties of Functions In Problems 69-76, use a aproximate any local maxima and local minima. Determine where the function is increasing and where it is decreasing. Round answers to two decimal places. graphing utility to graph each function over the indicated interval and C Sro 69. f(x) = x-3x + 2; (-2, 2) 70. f(x) x- 3x +5; (-1,3) 71. fx) = -x; (-2, 2) 72. f(x) xx; (-2,2) 1E0- x S 73. f(x) =-0.2x3 - 0.6x2 4x- 6; (-6, 4) 74. f(x) 0.4x3 0.6x2 3x - 2; (-4,5) saU 00) 75. f(x) = 0.25x4 +0.3x3 0.9x +3; (-3,2) mst: C td) 20ido 76. f(x) 0.4x4 0.5x3 0.8x2 2; (-3, 2) (a) Determine the height of the golf ball after it has 1. For the function f(x) = x2, compute each average rate of change: CE 100 feet. (b) What is the height after it has traveled 300 feet? (c) What is the height after it has traveled 500 feet? (d) How far was the golf ball hit? (e) Use a graphing utility to graph the function h = (f) Use a graphing utility to determine the distance ball has traveled when the height of the ball is 90 (g) Create a TABLE with TblStart 0 and ATbl 2. (h) To the nearest 25 feet, how far does the ball travel reaches a maximum height? What is the maximum Adiust the value of ATbl until you determine ,0) toin (c) from 0 to 0.1 (a) from 0 to 1 (b) from 0 to 0.01 (d) from 0 to 0.5 2-AZ bs x (e) from 0 to 0.00 1 (t) Graph each of the secant lines. Set the viewing rectangle -0.2, Xmay = 1.2, Xscl = 0.1, Ymin = -0.2, 1.2, Yscl 0 to: Xmin Ymax What do you think (h) What is happenir ecant lines? he secant lines? oser to? What is

Algebra and Trigonometry (MindTap Course List)
4th Edition
ISBN:9781305071742
Author:James Stewart, Lothar Redlin, Saleem Watson
Publisher:James Stewart, Lothar Redlin, Saleem Watson
Chapter2: Functions
Section2.FOM: Focus On Modeling: Modeling With Functions
Problem 30P

Related questions

Topic Video
Question
I need help with number 74
Transcribed Image Text:hGraphs of Functions; Properties of Functions
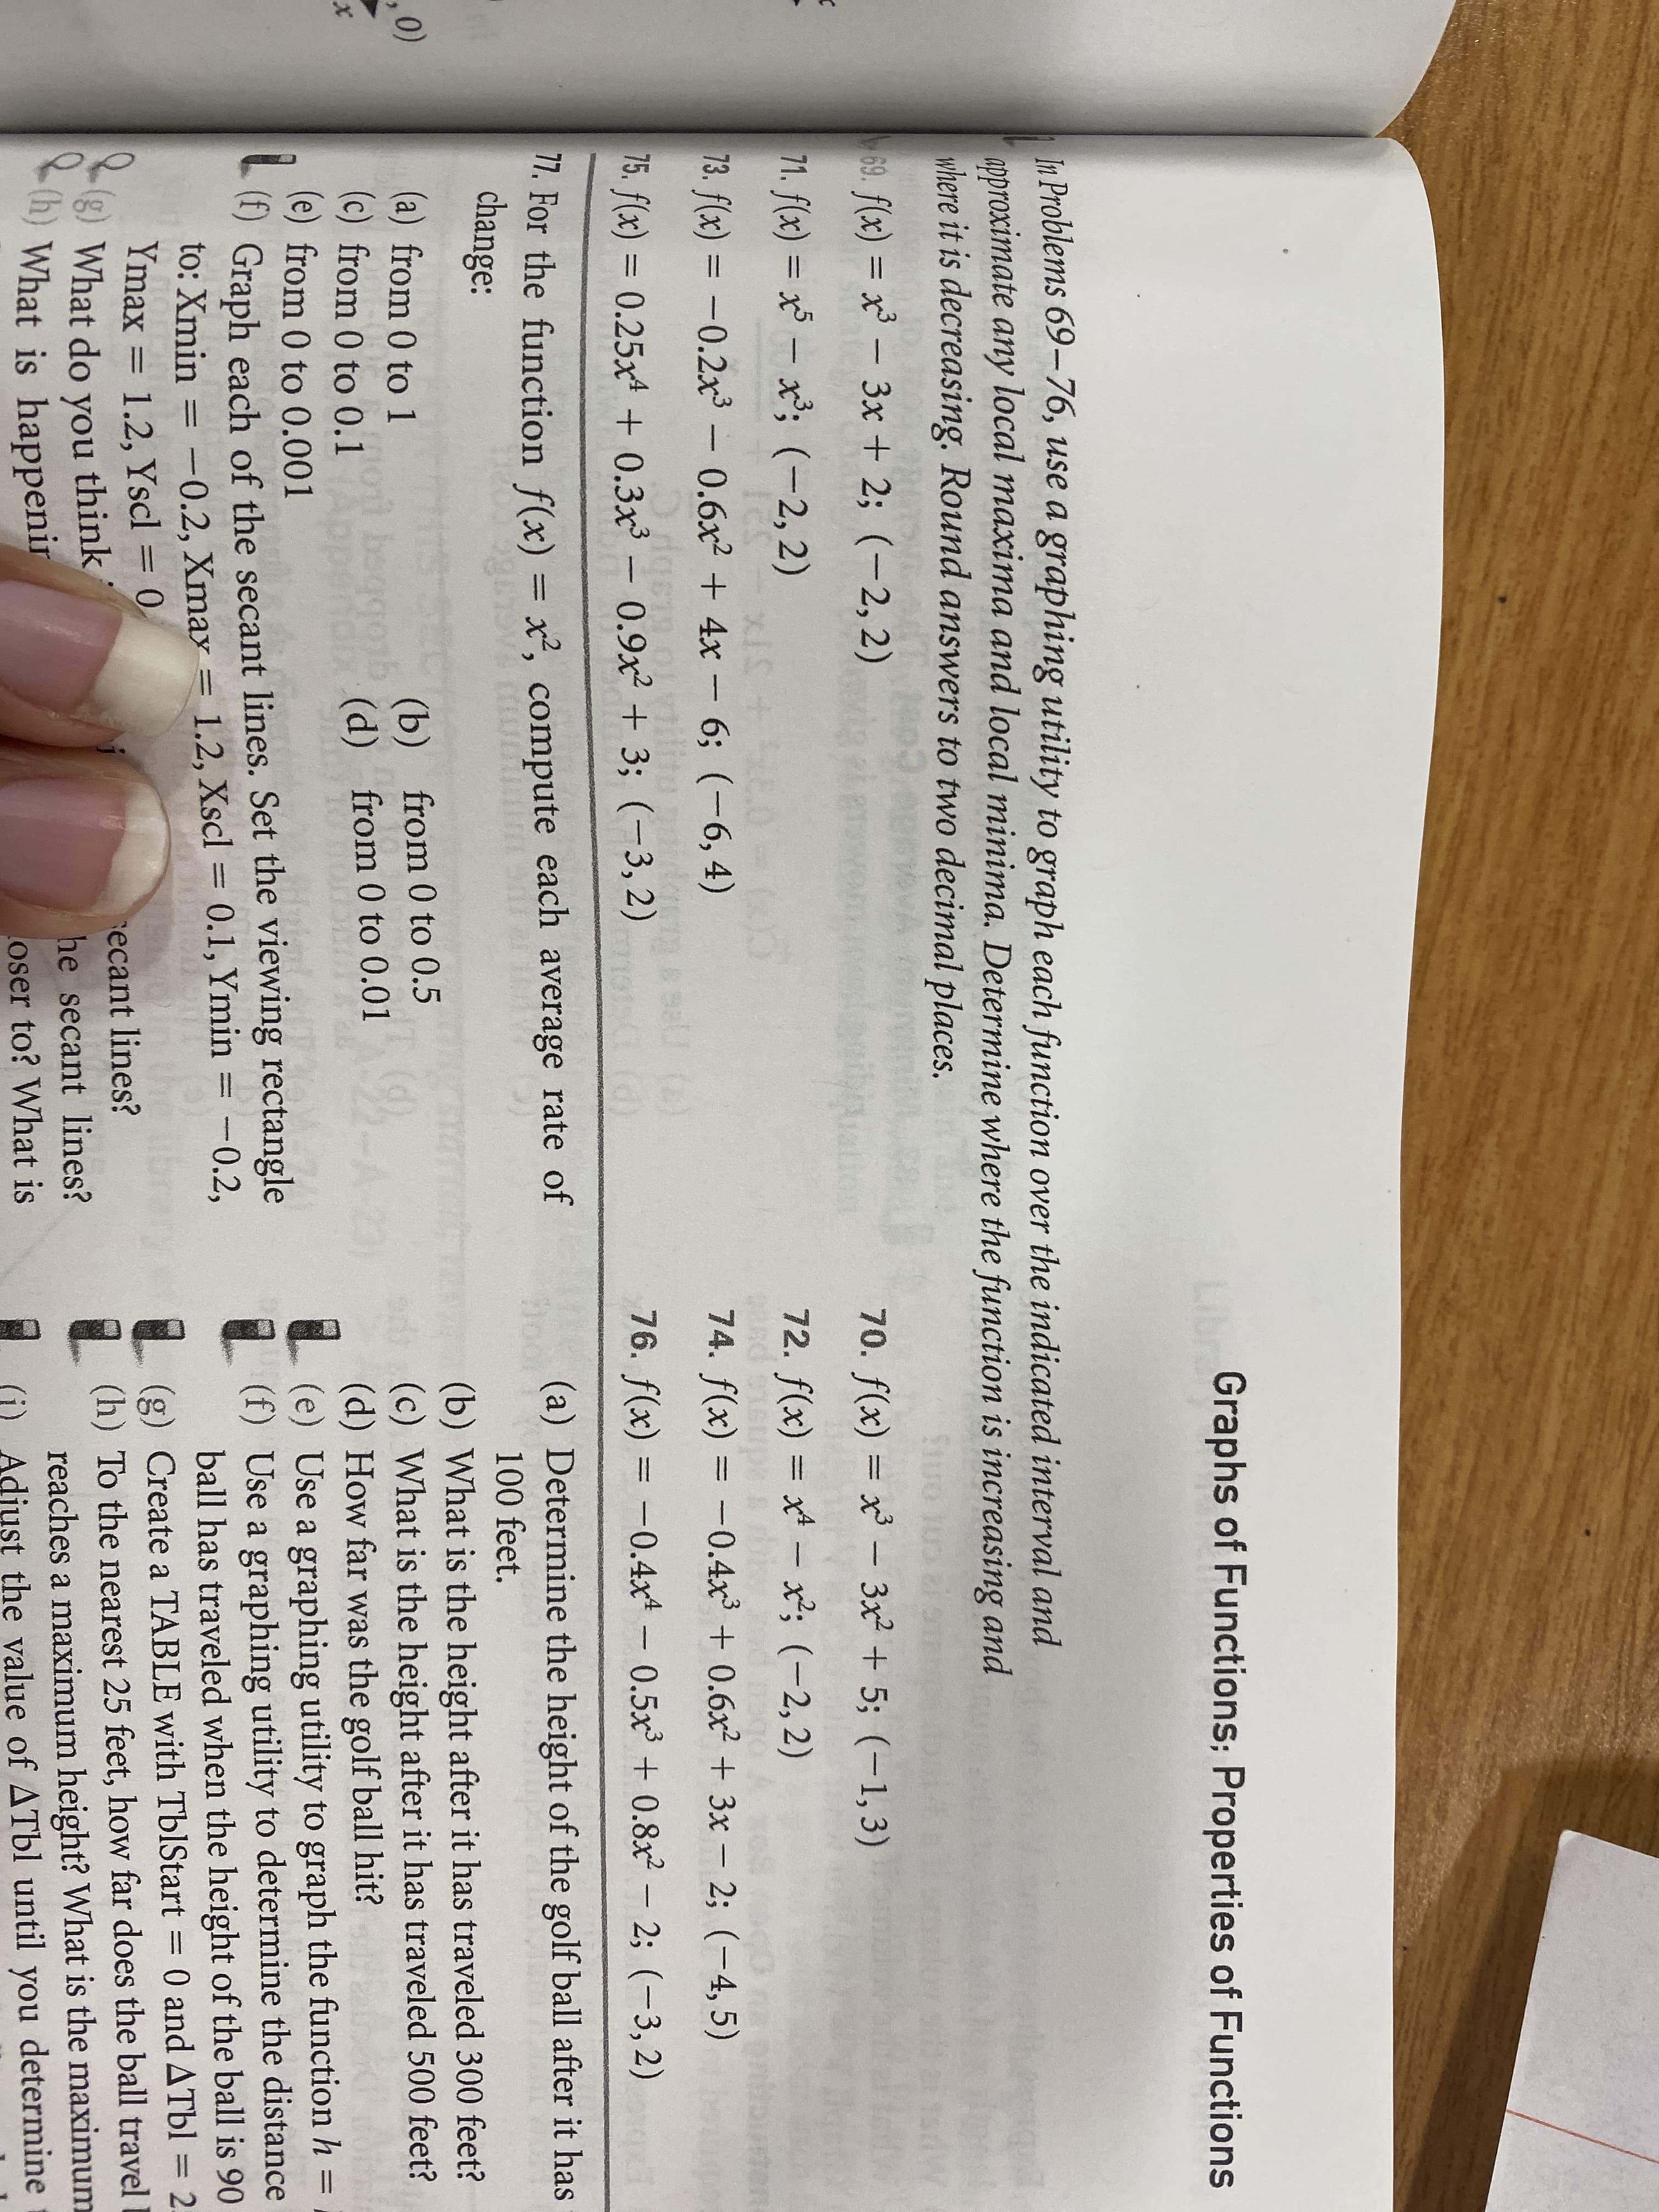
In Problems 69-76, use a
aproximate any local maxima and local minima. Determine where the function is increasing and
where it is decreasing. Round answers to two decimal places.
graphing utility to graph each function over the indicated interval and
C
Sro
69. f(x) = x-3x + 2; (-2, 2)
70. f(x) x- 3x +5; (-1,3)
71. fx) = -x; (-2, 2)
72. f(x) xx; (-2,2)
1E0-
x S
73. f(x) =-0.2x3 - 0.6x2 4x- 6; (-6, 4)
74. f(x)
0.4x3 0.6x2 3x - 2; (-4,5)
saU 00)
75. f(x) = 0.25x4 +0.3x3 0.9x +3; (-3,2) mst: C td)
20ido
76. f(x) 0.4x4 0.5x3 0.8x2 2; (-3, 2)
(a) Determine the height of the golf ball after it has
1. For the function f(x) = x2, compute each average rate of
change:
CE
100 feet.
(b) What is the height after it has traveled 300 feet?
(c) What is the height after it has traveled 500 feet?
(d) How far was the golf ball hit?
(e) Use a graphing utility to graph the function h =
(f) Use a graphing utility to determine the distance
ball has traveled when the height of the ball is 90
(g) Create a TABLE with TblStart 0 and ATbl 2.
(h) To the nearest 25 feet, how far does the ball travel
reaches a maximum height? What is the maximum
Adiust the value of ATbl until you determine
,0)
toin
(c) from 0 to 0.1
(a) from 0 to 1
(b)
from 0 to 0.01
(d)
from 0 to 0.5
2-AZ
bs
x
(e) from 0 to 0.00 1
(t) Graph each of the secant lines. Set the viewing rectangle
-0.2, Xmay = 1.2, Xscl = 0.1, Ymin = -0.2,
1.2, Yscl 0
to: Xmin
Ymax
What do you think
(h) What is happenir
ecant lines?
he secant lines?
oser to? What is
Expert Solution
This question has been solved!
Explore an expertly crafted, step-by-step solution for a thorough understanding of key concepts.

This is a popular solution!

Trending now
This is a popular solution!

Step by step
Solved in 5 steps with 3 images

Knowledge Booster


Learn more about
Need a deep-dive on the concept behind this application? Look no further. Learn more about this topic, algebra and related others by exploring similar questions and additional content below.Recommended textbooks for you
Algebra and Trigonometry (MindTap Course List)
Algebra
ISBN:
9781305071742
Author:
James Stewart, Lothar Redlin, Saleem Watson
Publisher:
Cengage Learning

Glencoe Algebra 1, Student Edition, 9780079039897…
Algebra
ISBN:
9780079039897
Author:
Carter
Publisher:
McGraw Hill
Algebra and Trigonometry (MindTap Course List)
Algebra
ISBN:
9781305071742
Author:
James Stewart, Lothar Redlin, Saleem Watson
Publisher:
Cengage Learning
Glencoe Algebra 1, Student Edition, 9780079039897…
Algebra
ISBN:
9780079039897
Author:
Carter
Publisher:
McGraw Hill