How can the standard error of estimate be interpreted?

College Algebra
7th Edition
ISBN:9781305115545
Author:James Stewart, Lothar Redlin, Saleem Watson
Publisher:James Stewart, Lothar Redlin, Saleem Watson
Chapter1: Equations And Graphs
Section: Chapter Questions
Problem 10T: Olympic Pole Vault The graph in Figure 7 indicates that in recent years the winning Olympic men’s...

Related questions
Question
How can the standard error of estimate be interpreted?
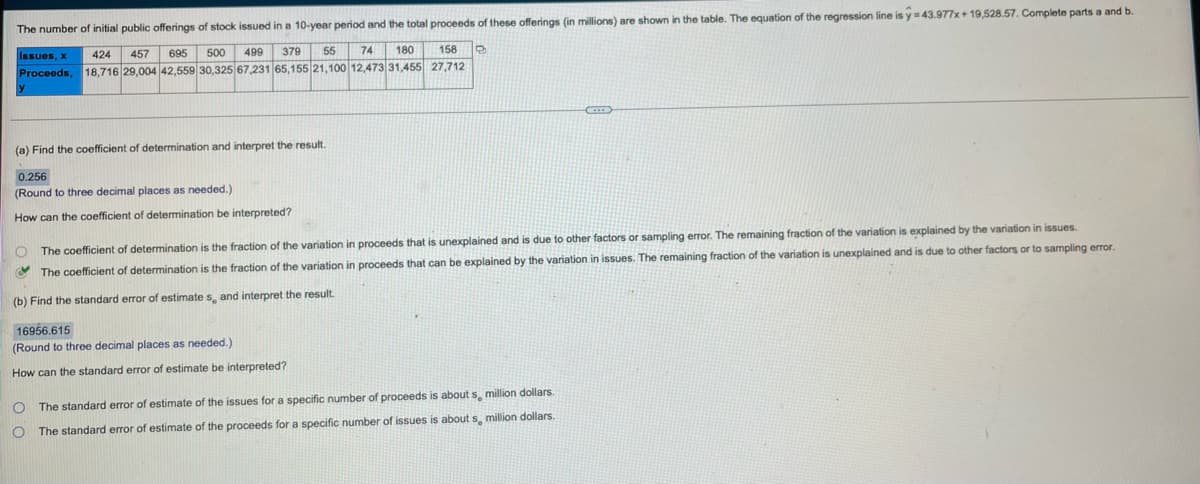
Transcribed Image Text:The number of initial public offerings of stock issued in a 10-year period and the total proceeds of these offerings (in millions) are shown in the table. The equation of the regression line is y = 43.977x+ 19,528.57. Complete parts a and bi
424
457
695
500
499
379
55
74
180
158
Issues, x
Proceeds,
18,716 29,004 42,559 30,325 67,231 65,155 21,100 12,473 31,455 27,712
(a) Find the coefficient of determination and interpret the result.
0.256
(Round to three decimal places as needed.)
How can the coefficient of determination be interpreted?
The coefficient of determination is the fraction of the variation in proceeds that is unexplained and is due to other factors or sampling error. The remaining fraction of the variation is explained by the variation in issues.
O The coefficient of determination is the fraction of the variation in proceeds that can be explained by the variation in issues. The remaining fraction of the variation is unexplained and is due to other factors or to sampling error.
(b) Find the standard error of estimate s, and interpret the result.
16956.615
(Round to three decimal places as needed.)
How can the standard error of estimate be interpreted?
O The standard error of estimate of the issues for a specific number of proceeds is about s, million dollars.
The standard error of estimate of the proceeds for a specific number of issues is about s, million dollars.
Expert Solution
This question has been solved!
Explore an expertly crafted, step-by-step solution for a thorough understanding of key concepts.

This is a popular solution!

Trending now
This is a popular solution!

Step by step
Solved in 2 steps

Recommended textbooks for you
College Algebra
Algebra
ISBN:
9781305115545
Author:
James Stewart, Lothar Redlin, Saleem Watson
Publisher:
Cengage Learning

Algebra & Trigonometry with Analytic Geometry
Algebra
ISBN:
9781133382119
Author:
Swokowski
Publisher:
Cengage

Algebra and Trigonometry (MindTap Course List)
Algebra
ISBN:
9781305071742
Author:
James Stewart, Lothar Redlin, Saleem Watson
Publisher:
Cengage Learning
College Algebra
Algebra
ISBN:
9781305115545
Author:
James Stewart, Lothar Redlin, Saleem Watson
Publisher:
Cengage Learning
Algebra & Trigonometry with Analytic Geometry
Algebra
ISBN:
9781133382119
Author:
Swokowski
Publisher:
Cengage
Algebra and Trigonometry (MindTap Course List)
Algebra
ISBN:
9781305071742
Author:
James Stewart, Lothar Redlin, Saleem Watson
Publisher:
Cengage Learning

Trigonometry (MindTap Course List)
Trigonometry
ISBN:
9781305652224
Author:
Charles P. McKeague, Mark D. Turner
Publisher:
Cengage Learning

Functions and Change: A Modeling Approach to Coll…
Algebra
ISBN:
9781337111348
Author:
Bruce Crauder, Benny Evans, Alan Noell
Publisher:
Cengage Learning