How many years is a randomly selected 20-year-old expected to live beyond his or her 20th birthday? Use the data in the table for people between the ages of 16 and 21 years. E Click the icon to view the table. A randomly selected 20-year-old is expected to live years beyond his or her 20th birthday. Data Table Number Expected remaining lifetime (from the beginning of the interval) Probability of dying during the interval Number of Age interval surviving to the beginning of the interval deaths during the interval 0.000606 98,977 98,870 98,812 98,752 98,642 16-17 60 61.6 17-18 0.000708 70 60.6 18-19 0.000779 77 59.6 19-20 0.000810 80 58.4 20-21 0.000902 89 57.3 Print Done
How many years is a randomly selected 20-year-old expected to live beyond his or her 20th birthday? Use the data in the table for people between the ages of 16 and 21 years. E Click the icon to view the table. A randomly selected 20-year-old is expected to live years beyond his or her 20th birthday. Data Table Number Expected remaining lifetime (from the beginning of the interval) Probability of dying during the interval Number of Age interval surviving to the beginning of the interval deaths during the interval 0.000606 98,977 98,870 98,812 98,752 98,642 16-17 60 61.6 17-18 0.000708 70 60.6 18-19 0.000779 77 59.6 19-20 0.000810 80 58.4 20-21 0.000902 89 57.3 Print Done

College Algebra
7th Edition
ISBN:9781305115545
Author:James Stewart, Lothar Redlin, Saleem Watson
Publisher:James Stewart, Lothar Redlin, Saleem Watson
Chapter9: Counting And Probability
Section9.3: Binomial Probability
Problem 33E: Sick leave probability that a given worker at Dyno Nutrition Will call in sick on a Monday is 004....

Related questions
Topic Video
Question
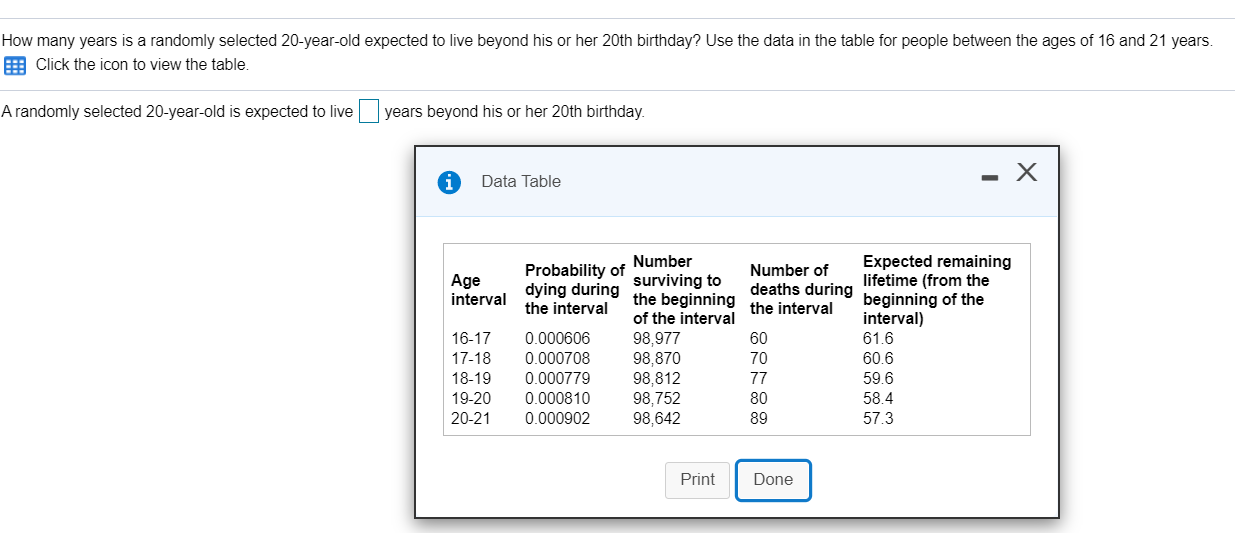
How many years is a randomly selected 20-year-oldexpected to live beyond his or her 20th birthday? Use the data in the table for people between the ages of 16 and 21 years.
Transcribed Image Text:How many years is a randomly selected 20-year-old expected to live beyond his or her 20th birthday? Use the data in the table for people between the ages of 16 and 21 years.
E Click the icon to view the table.
A randomly selected 20-year-old is expected to live
years beyond his or her 20th birthday.
Data Table
Number
Expected remaining
lifetime (from the
beginning of the
interval)
Probability of
dying during
the interval
Number of
Age
interval
surviving to
the beginning
of the interval
deaths during
the interval
0.000606
98,977
98,870
98,812
98,752
98,642
16-17
60
61.6
17-18
0.000708
70
60.6
18-19
0.000779
77
59.6
19-20
0.000810
80
58.4
20-21
0.000902
89
57.3
Print
Done
Expert Solution
This question has been solved!
Explore an expertly crafted, step-by-step solution for a thorough understanding of key concepts.

This is a popular solution!

Trending now
This is a popular solution!

Step by step
Solved in 2 steps

Knowledge Booster


Learn more about
Need a deep-dive on the concept behind this application? Look no further. Learn more about this topic, statistics and related others by exploring similar questions and additional content below.Recommended textbooks for you
College Algebra
Algebra
ISBN:
9781305115545
Author:
James Stewart, Lothar Redlin, Saleem Watson
Publisher:
Cengage Learning

Algebra and Trigonometry (MindTap Course List)
Algebra
ISBN:
9781305071742
Author:
James Stewart, Lothar Redlin, Saleem Watson
Publisher:
Cengage Learning

Algebra & Trigonometry with Analytic Geometry
Algebra
ISBN:
9781133382119
Author:
Swokowski
Publisher:
Cengage
College Algebra
Algebra
ISBN:
9781305115545
Author:
James Stewart, Lothar Redlin, Saleem Watson
Publisher:
Cengage Learning
Algebra and Trigonometry (MindTap Course List)
Algebra
ISBN:
9781305071742
Author:
James Stewart, Lothar Redlin, Saleem Watson
Publisher:
Cengage Learning
Algebra & Trigonometry with Analytic Geometry
Algebra
ISBN:
9781133382119
Author:
Swokowski
Publisher:
Cengage