I am confused about how to find the confidence interval (at the 90% level) of the remaining data points on part C. Which then leads to not being able to figure out part D to find that higher level of confidence.
I am confused about how to find the confidence interval (at the 90% level) of the remaining data points on part C. Which then leads to not being able to figure out part D to find that higher level of confidence.

MATLAB: An Introduction with Applications
6th Edition
ISBN:9781119256830
Author:Amos Gilat
Publisher:Amos Gilat
Chapter1: Starting With Matlab
Section: Chapter Questions
Problem 1P

Related questions

Question
100%
I am confused about how to find the confidence interval (at the 90% level) of the remaining data points on part C. Which then leads to not being able to figure out part D to find that higher level of confidence.
I attached the chart of confidence levels for these questions. Thank you!
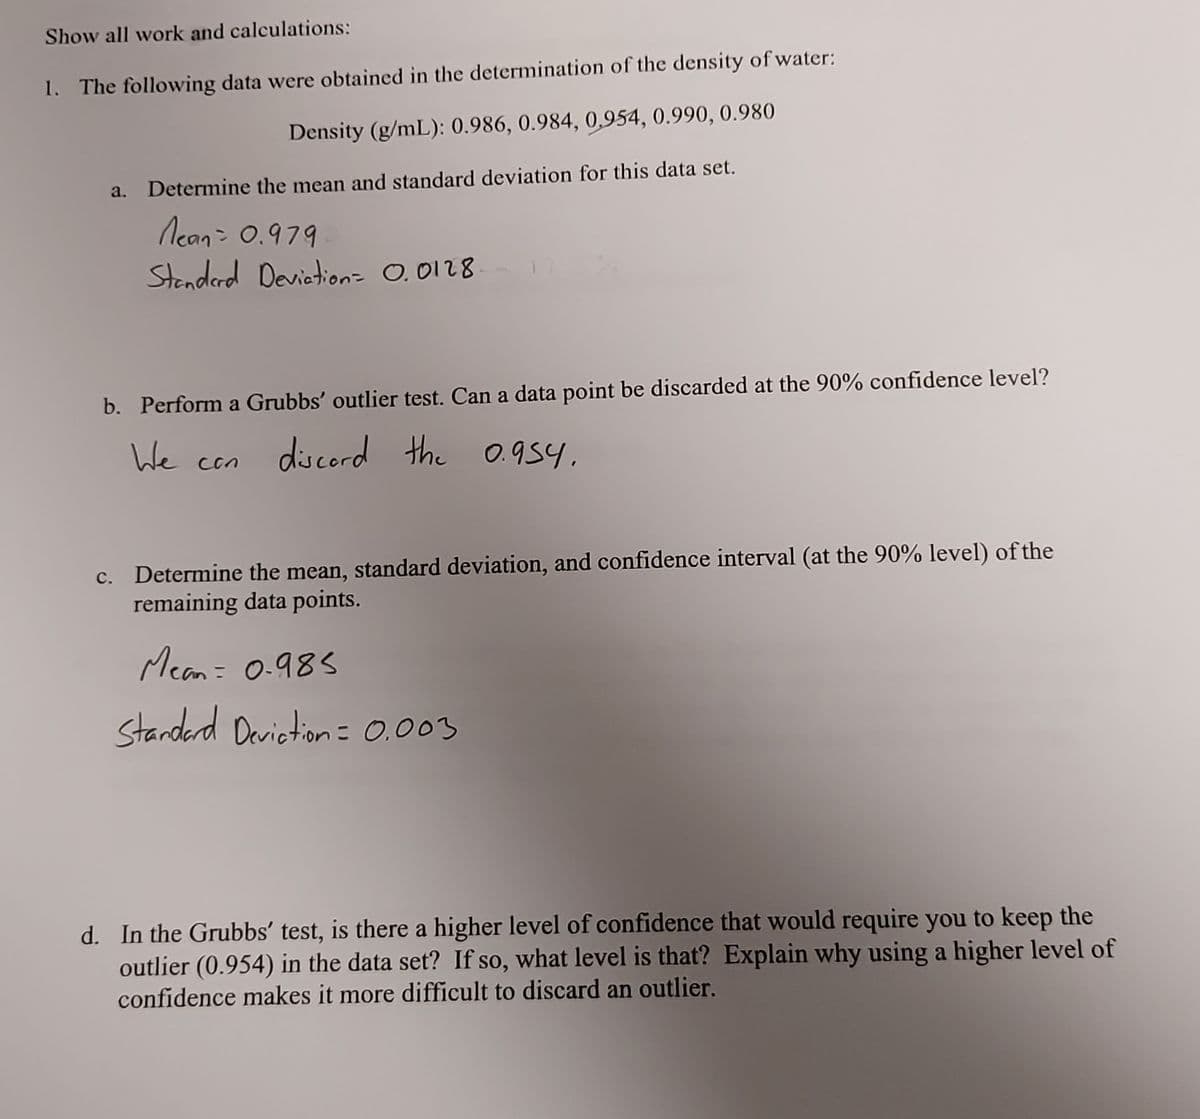
Transcribed Image Text:Show all work and calculations:
1. The following data were obtained in the determination of the density of water:
Density (g/mL): 0.986, 0.984, 0,954, 0.990, 0.980
a.
Determine the mean and standard deviation for this data set.
Ncan: 0.979
Stenderd Devietion- 0.0128
b. Perform a Grubbs' outlier test. Can a data point be discarded at the 90% confidence level?
We con
discord the 0.954.
c. Determine the mean, standard deviation, and confidence interval (at the 90% level) of the
remaining data points.
Mean= 0.985
starderd Daviction= 0.003
d. In the Grubbs' test, is there a higher level of confidence that would require you to keep the
outlier (0.954) in the data set? If so, what level is that? Explain why using a higher level of
confidence makes it more difficult to discard an outlier.
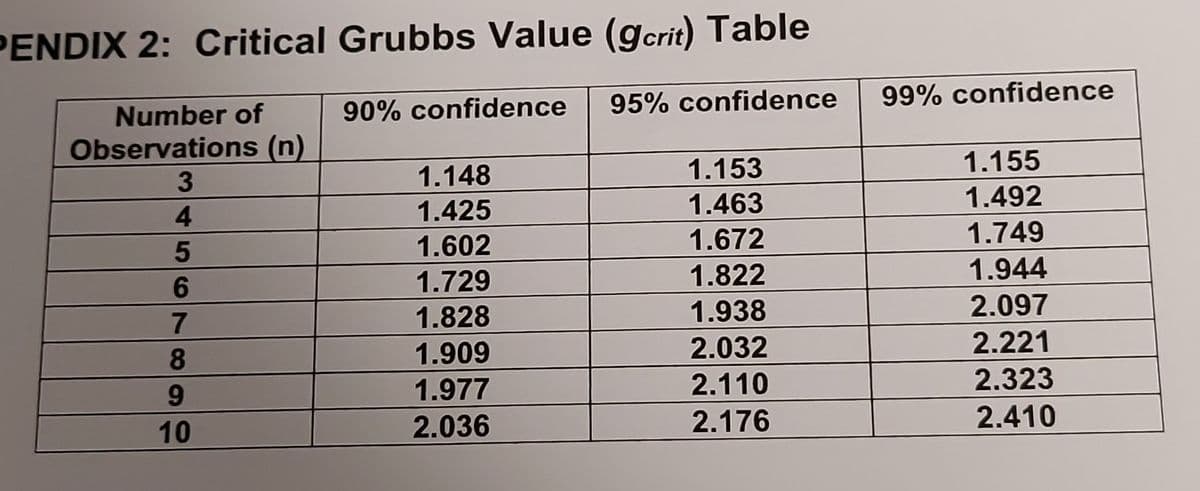
Transcribed Image Text:PENDIX 2: Critical Grubbs Value (gcrit) Table
95% confidence
99% confidence
Number of
90% confidence
Observations (n)
1.155
1.153
1.463
1.148
1.492
4
1.425
1.602
1.672
1.749
1.729
1.822
1.944
6.
1.828
1.938
2.097
7.
1.909
2.032
2.221
1.977
2.110
2.323
9.
10
2.036
2.176
2.410
Expert Solution
Step 1
I am only solving C & D that based on your calculations.
c) We see that, removing the outlier value, there are 4 data points.
Hence, sample size = n = 4.
Mean = m = 0.983
S.D. = s = 0.003
We see that, for sample size (no. of observations) 4, the 90% confidence level is 1.425.

Trending now
This is a popular solution!

Step by step
Solved in 2 steps with 1 images

Knowledge Booster


Learn more about
Need a deep-dive on the concept behind this application? Look no further. Learn more about this topic, statistics and related others by exploring similar questions and additional content below.Recommended textbooks for you
MATLAB: An Introduction with Applications
Statistics
ISBN:
9781119256830
Author:
Amos Gilat
Publisher:
John Wiley & Sons Inc

Probability and Statistics for Engineering and th…
Statistics
ISBN:
9781305251809
Author:
Jay L. Devore
Publisher:
Cengage Learning

Statistics for The Behavioral Sciences (MindTap C…
Statistics
ISBN:
9781305504912
Author:
Frederick J Gravetter, Larry B. Wallnau
Publisher:
Cengage Learning
MATLAB: An Introduction with Applications
Statistics
ISBN:
9781119256830
Author:
Amos Gilat
Publisher:
John Wiley & Sons Inc
Probability and Statistics for Engineering and th…
Statistics
ISBN:
9781305251809
Author:
Jay L. Devore
Publisher:
Cengage Learning
Statistics for The Behavioral Sciences (MindTap C…
Statistics
ISBN:
9781305504912
Author:
Frederick J Gravetter, Larry B. Wallnau
Publisher:
Cengage Learning

Elementary Statistics: Picturing the World (7th E…
Statistics
ISBN:
9780134683416
Author:
Ron Larson, Betsy Farber
Publisher:
PEARSON

The Basic Practice of Statistics
Statistics
ISBN:
9781319042578
Author:
David S. Moore, William I. Notz, Michael A. Fligner
Publisher:
W. H. Freeman

Introduction to the Practice of Statistics
Statistics
ISBN:
9781319013387
Author:
David S. Moore, George P. McCabe, Bruce A. Craig
Publisher:
W. H. Freeman